Blog · Custom Web Controls
The 8 best data table Custom Web Controls for WinCC Unified and WinCC V8 (free)
We opened every data table, log and SQL grid Custom Web Control in the HMIx catalogue in early November 2026, thirteen candidates, looked at each preview up close, read every product sheet and kept the eight we would happily drop into a WinCC Unified or WinCC V8 screen. All free, all packaged as a CWC ZIP, and all with properties named on their sheets so you know what you will bind.
- Custom Web Control
- CWC
- WinCC Unified
- WinCC V8
- TIA Portal
- Data table
- SQL Server
- SCADA widgets
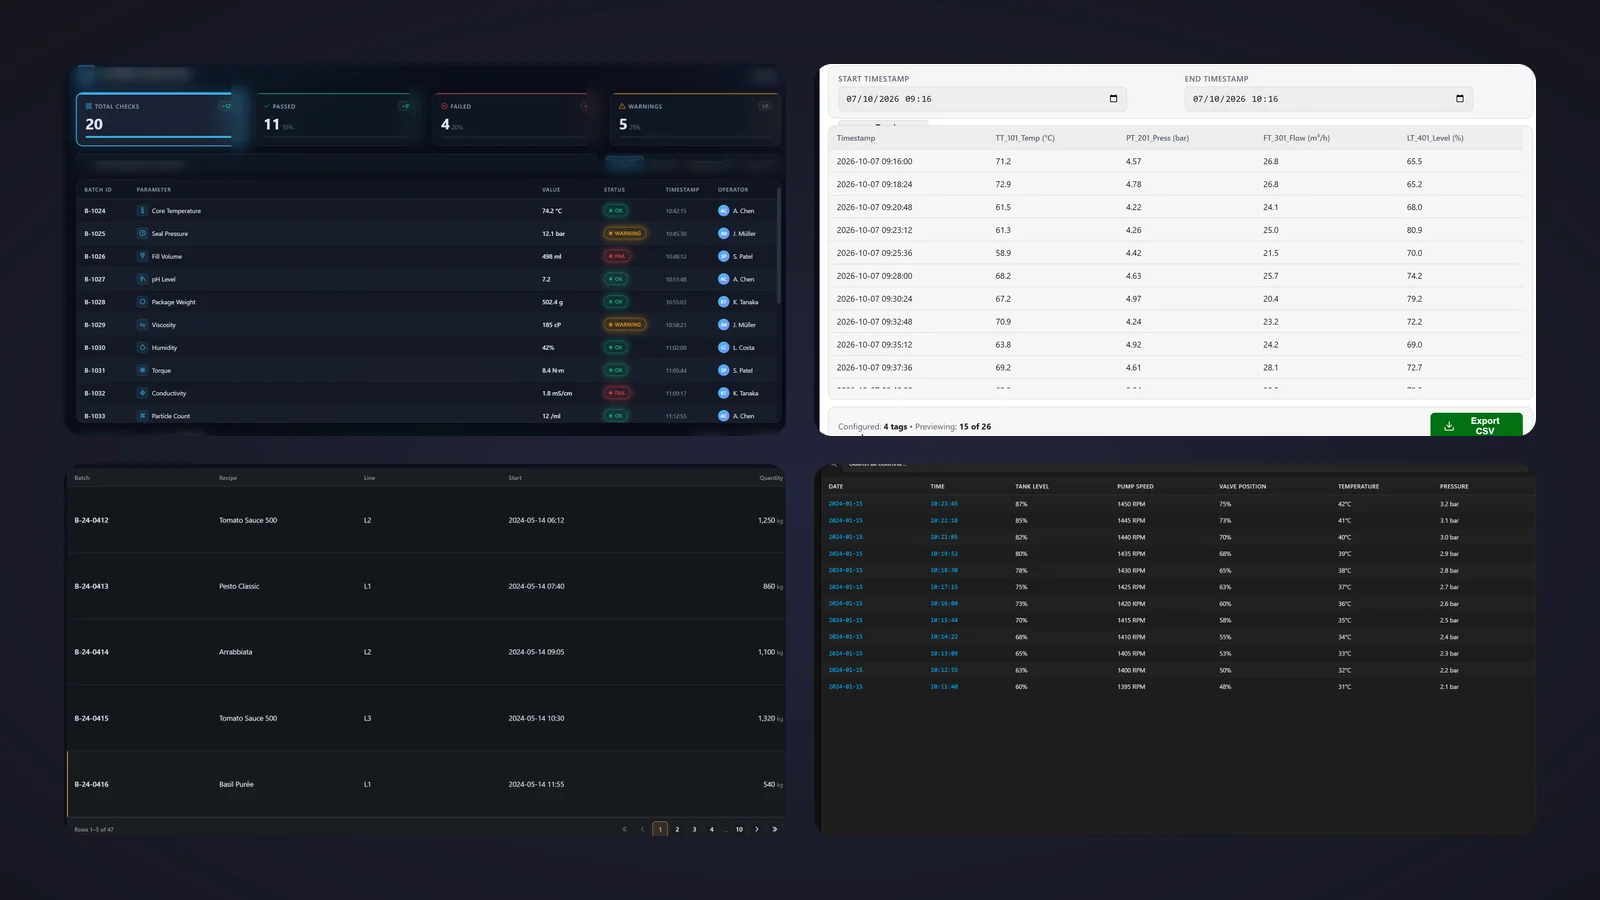
Quick picks
Short on time? Jump straight to the table you need.
- 01Best overallDynamic Data Table
- 02Best for SQL Server records (add, edit and delete)Table SQL Server
- 03Best for quality control logsQuality Control Log
- 04Best lightweight table for live tag valuesData Table
- 05Best for browsing batch records page by pagePaginated Records Table
- 06Best for exporting historical data to CSVHistorical Data CSV Exporter
- 07Best for inspection and weighing logsInspection Log
- 08Crowd favourite: the most flexible (Tabulator)Custom table
Why a data table Custom Web Control is worth it
Sooner or later every HMI project needs a table. Production orders for the shift, the last twenty batches, quality checks with a pass or fail, inspection weights, a SQL query the plant manager wants on the screen "just like in Excel". Gauges and trends tell the operator how the process is doing; a data table tells them what happened, item by item, with names, times and values they can look up.
The standard WinCC objects are built for specific data: alarms, trends, parameter sets. When you want a grid of your own records, with search, pages, status colours and a row the operator can click, a data table Custom Web Control (CWC) is the shortcut. A CWC is a small web application, HTML, CSS and JavaScript packaged as a ZIP, that WinCC Unified (TIA Portal) and WinCC V8 run inside the screen. A table CWC usually takes its rows as a JSON string in a property such as dataJson or recordsJson, and it fires events, such as RowSelected, that your HMI scripts can answer.
What makes a data table Custom Web Control worth downloading
Before the list, the yardstick. This is what we looked for, roughly in order of how much it annoys us when it is missing:
- Readable at a glance. A clear header, aligned numbers, units and status colours that mean something. A table the operator has to decipher is a table nobody reads.
- Volume under control. Search, paging or a row limit (
rowsPerPage,pageSize,maxDisplayedRows), so the screen stays fast and nobody scrolls through a thousand lines on a 12-inch panel. - A clean data contract. Rows in one documented property and the column layout in another, so you know exactly what your script has to write.
- Interaction that goes somewhere. A row click event, a refresh request or a CSV export turn a list into a tool. Sheets that only count their properties went to the honourable mentions.
- The right table for the job. A historical log, a SQL Server editor, a quality log, a live tag list, a batch browser, an exporter, an inspection log and a do-it-all grid: we picked one champion per job.
How we picked them (and what we did not do)
We searched the HMIx catalogue in early November 2026 for every free Custom Web Control built around rows and columns: data tables, logs, SQL grids, CSV exporters and record browsers. Full applications that happen to contain a table, such as inventory or batch managers, were left for another day. For each candidate we looked at its real preview (not the catalogue cover with the big title on top) and read its product sheet to see which properties, events and methods it documents. Downloads only worked as tie-breakers.
Controls whose sheets do not name their properties went to the honourable mentions. Four were discarded: three galleries only show the control's icon, so there is nothing to judge, and in the fourth the text of the cells is practically invisible. And a fair warning: we judged previews and documentation; we did not run these controls in a live Runtime or against a real database. They were generated with AI and every product page reminds you to test them in your own TIA Portal project before production.
The 8 best data table Custom Web Controls, one by one
Each entry shows the real preview, what we liked, what to keep in mind and the properties named on its product sheet, followed by the catalogue thumbnail: click it to open the product page and download the table for free.
01Best overall
Dynamic Data Table
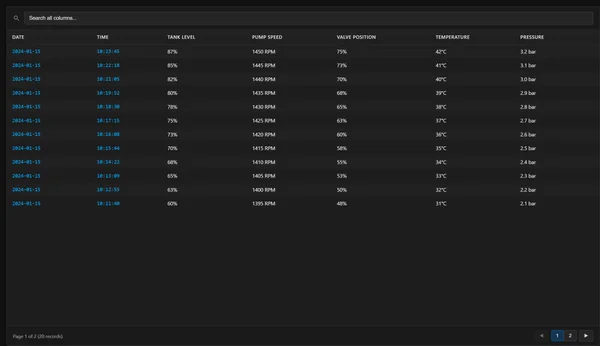
If we could only keep one, it would be this one. A dark, calm grid with a "Search all columns..." box on top, the date and time of each record in blue monospace and five process columns: tank level, pump speed, valve position, temperature and pressure. At the bottom, "Page 1 of 2 (20 records)" and a small pager. Nothing flashy, everything where you expect it, and with two five-star reviews in November 2026.
It is built for historical data. According to its sheet, it generates the Date and Time columns itself and adds five configurable process columns, defined in columnSettings and fed through historicalData. rowsPerPage sets the paging, searchPlaceholder and noDataMessage cover the texts, and backgroundColor matches your theme. RowSelected and PageChanged let your scripts react, and the exportToCsv method downloads the filtered rows for a report.
What we like
- Search, paging and CSV export in one tidy control
- Date and time handled for you, values in clear columns
- Short interface: two JSON properties do most of the work
Keep in mind
- Five process columns, according to its sheet: for wider records pick another table
- There is no export button in the preview: call
exportToCsvfrom a button of your own
Bindable properties
- historicalData
- columnSettings
- rowsPerPage
- searchPlaceholder
- noDataMessage
- backgroundColor
02Best for SQL Server records (add, edit and delete)
Table SQL Server
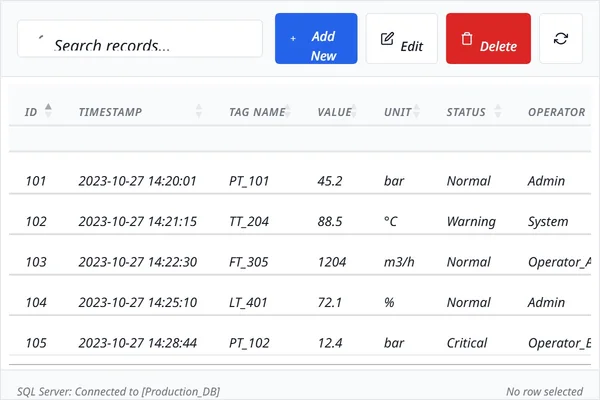
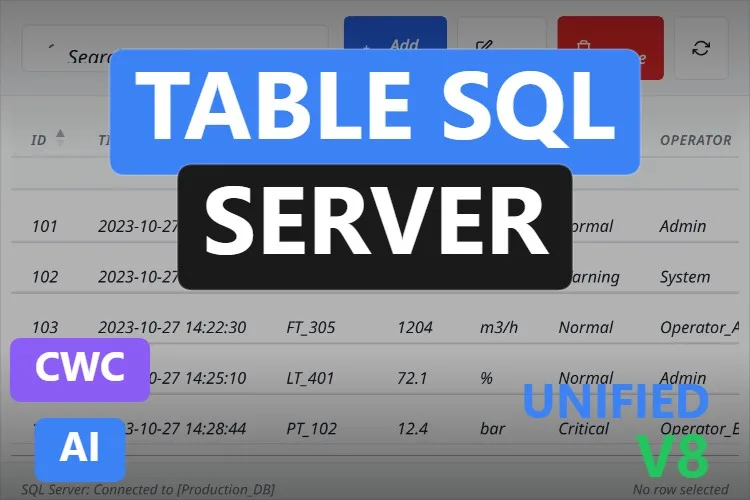
The one for people who live in a database. A light toolbar with a search box, a blue "Add New", "Edit", a red "Delete" and a refresh button sits over a sortable table with ID, timestamp, tag name, value, unit, status and operator columns. The footer says "SQL Server: Connected to [Production_DB]" on one side and "No row selected" on the other. With four reviews averaging 4.75 stars in November 2026, it is the most reviewed table in this article.
Its sheet counts 21 properties and names twenty. The SQL side is explicit: sqlSelectQuery, sqlInsertQuery, sqlUpdateQuery and sqlDeleteQuery hold the query templates, primaryKeyColumn identifies the row, and the connection is either dbConnectionString or dbServer, dbDatabase, dbUser and dbPassword. showAddButton, showEditButton and showDeleteButton decide what the operator may do, with their own labels. The buttons raise AddRequested, EditRequested, DeleteRequested and RefreshRequested for your WinCC scripts, and setTableData, setConnectionStatus and clearSelection let scripts write back.
What we like
- Full add, edit and delete workflow with events for every action
- Buttons you can hide per screen or per user role
- The most reviewed table in this article
Keep in mind
- Read the included documentation to see where the queries actually run in your architecture before promising live SQL, and never put a database password in a tag operators can read
- In the preview every text is in italics, "Search records..." is clipped at the top, "Add New" wraps and the operator column runs off the edge
Bindable properties
- sqlSelectQuery
- sqlInsertQuery
- sqlUpdateQuery
- sqlDeleteQuery
- primaryKeyColumn
- dbConnectionString
- dbServer
- dbDatabase
- dbUser
- dbPassword
- showAddButton
- showEditButton
- showDeleteButton
- addLabel
- editLabel
- deleteLabel
- searchPlaceholder
- connectionStatusText
- noSelectionText
- backgroundColor
03Best for quality control logs
Quality Control Log
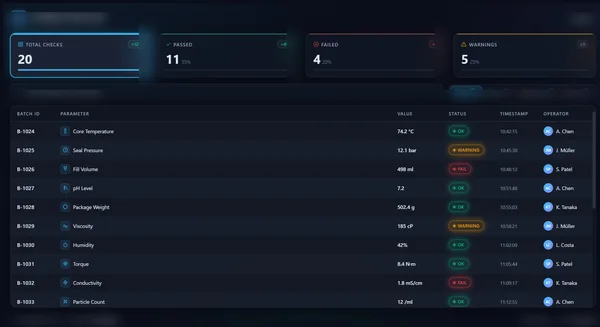
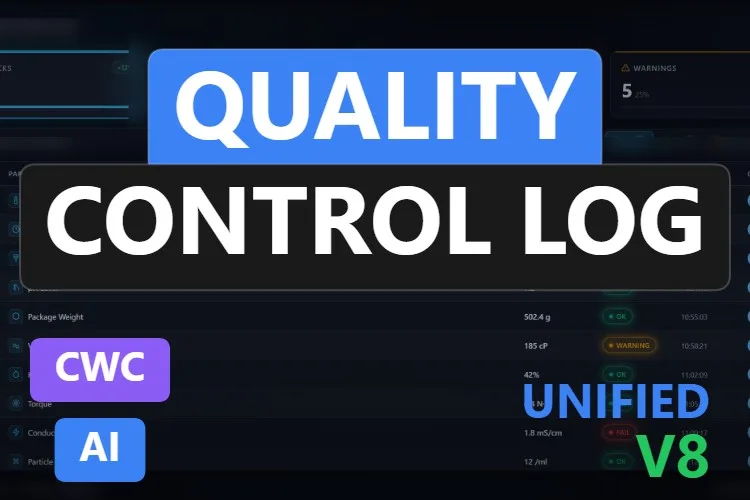
The best-looking table on the list. Four summary cards sit on top: Total Checks 20, Passed 11 (55 %), Failed 4 (20 %) and Warnings 5 (25 %), each with its colour. Underneath, a dense table lists batch IDs from B-1024, a parameter with its own icon (core temperature, seal pressure, fill volume, pH level…), the value with its unit, a glowing OK, WARNING or FAIL badge, the time and the operator with a round avatar of their initials.
Its sheet lists 10 properties and names nine: title and subtitle, the card labels totalLabel, passedLabel, failedLabel and warningsLabel, showFilters and searchPlaceholder for the search and status filters, and backgroundColor. OnRowSelection opens the door to a batch detail screen, and the clearSearch and setFilter methods let a script jump straight to the failures.
What we like
- Summary counters and a detailed log in a single control
- Status badges that stand out without shouting
- Search and status filtering built in
Keep in mind
- The sheet does not name the property that carries the records: check the Interface list in TIA Portal before binding
- In the preview the header with the title and filters is blurred and the right edge of the summary cards is cut off
Bindable properties
- title
- subtitle
- totalLabel
- passedLabel
- failedLabel
- warningsLabel
- showFilters
- searchPlaceholder
- backgroundColor
04Best lightweight table for live tag values
Data Table
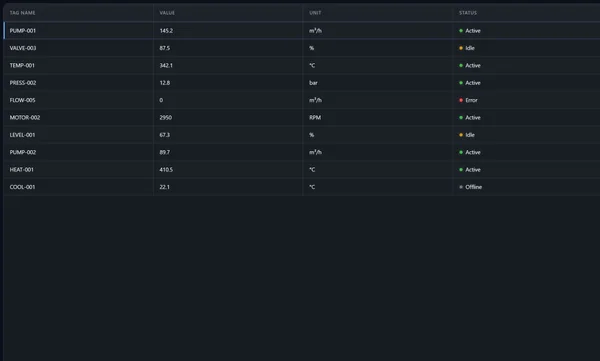
Sometimes all you need is a clean list. This one shows tag name, value, unit and status for ten signals, from PUMP-001 at 145.2 m³/h to COOL-001 at 22.1 °C, with a coloured dot for Active, Idle, Error or Offline. The selected row is marked with a blue bar on its left edge. High contrast, no decoration, easy to read from a metre away.
Its interface is just as lean. dataJson carries the rows and columns defines the schema, rowHeight and headerHeight adjust the density, emptyMessage covers the no-data case and backgroundColor matches your screen. According to its sheet the header is sticky, RowSelected fires on a click and selectedRowIndex can write the selection back to a tag (untick Read only for it). clearSelection and scrollToTop reset the view.
What we like
- Very legible, with a sticky header for long lists
- Selection written back to a tag for linked faceplates
- Quick to bind: one data property and one column definition
Keep in mind
- Its sheet mentions no search, sorting or paging: keep it for short lists
- Half of the preview is empty space below the rows, so size it to your row count
Bindable properties
- dataJson
- columns
- selectedRowIndex
- rowHeight
- headerHeight
- emptyMessage
- backgroundColor
05Best for browsing batch records page by page
Paginated Records Table
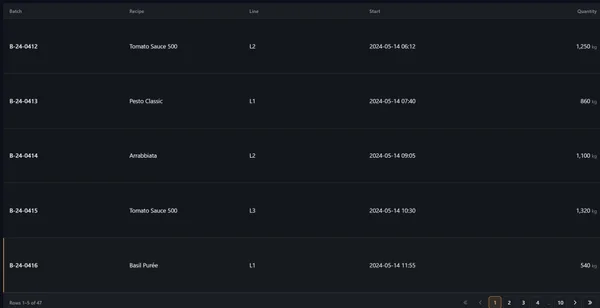
The newest table in this article, published in October 2026, and a thoughtful one. Five batch records fill the control, from B-24-0412 "Tomato Sauce 500" on line L2 to B-24-0416 "Basil Purée", with recipe, line, start time and a right-aligned quantity in kg. The footer reads "Rows 1–5 of 47" next to a pager with first, previous, page numbers, next and last.
Its 17 properties describe a clean split of work. Your project scripts query the database and write the current page to rows, the database size to totalCount and the confirmed page to pageIndex after a PageChanged event. pageSize, columns (labels, alignment and units) and rangeTemplate shape the view. Clicking a row, or pressing Enter or Space, fires RowClicked and opens a dimmed sheet with the name, value and unit of each stored parameter, which you supply through selectedParameters and parametersRowId.
What we like
- Server-side paging: the panel only holds the rows on screen
- A parameter detail sheet for each record, closable with Esc
- Keyboard support and accessible labels
Keep in mind
- Rows are very tall in the preview, so you see few records at a time
- Nothing works without your scripts: the queries live in your project, not in the control
Bindable properties
- rows
- totalCount
- pageIndex
- pageSize
- columns
- rangeTemplate
- selectedParameters
- parametersRowId
- backgroundColor
06Best for exporting historical data to CSV
Historical Data CSV Exporter
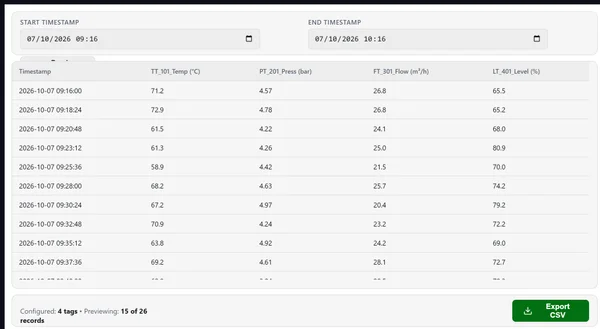
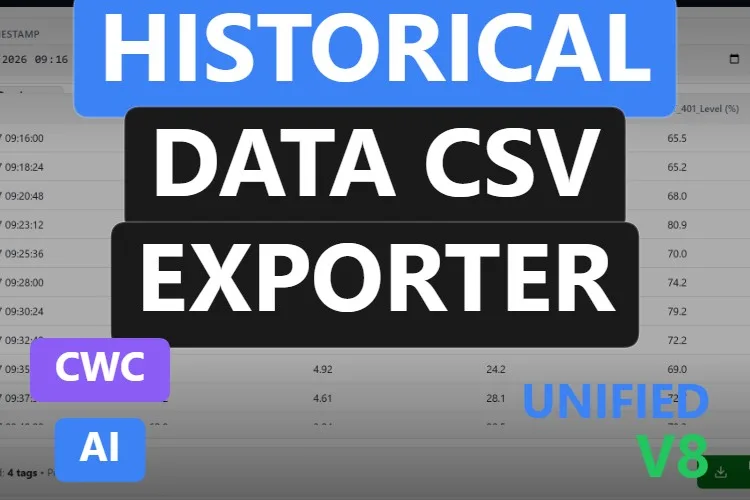
For the classic request: "can I get last night's data in Excel?". Two date and time pickers set the window, from 09:16 to 10:16 in the preview, and a table previews the records with a timestamp and four logging tags: TT_101 temperature in °C, PT_201 pressure in bar, FT_301 flow in m³/h and LT_401 level in %. The footer reads "Configured: 4 tags • Previewing: 15 of 26 records", next to a big green "Export CSV" button.
Its sheet names the whole flow. startTimestamp and endTimestamp hold the window (untick Read only so the operator's choice reaches the tags), startLabel and endLabel translate the captions, and loggingTags lists the columns. Your script answers QueryRequested by writing the records into historicalDataJson, maxPreviewRows limits the preview, and the export builds a CSV named with fileNamePrefix and raises ExportTriggered. previewButtonText, exportButtonText, setHistoricalData and triggerExport complete it.
What we like
- A complete query, preview and export flow on one screen
- Consistent file names for shift and audit reports
- Light, office-like look that suits reporting screens
Keep in mind
- In the preview a button under the date pickers is almost completely hidden behind the table
- It does not read your archive by itself: a script has to fill
historicalDataJson
Bindable properties
- startTimestamp
- endTimestamp
- loggingTags
- historicalDataJson
- maxPreviewRows
- fileNamePrefix
- startLabel
- endLabel
- previewButtonText
- exportButtonText
- backgroundColor
Historical Data CSV Exporter
Free · WinCC Unified & V8 · CWC (.zip)
07Best for inspection and weighing logs
Inspection Log
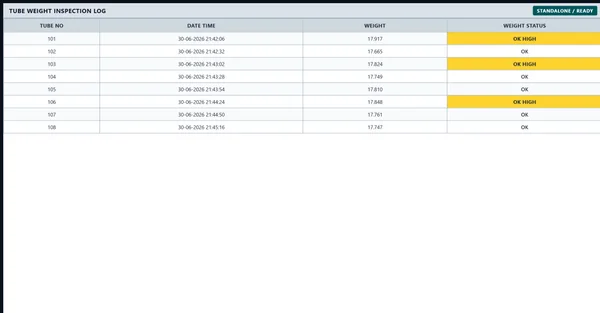
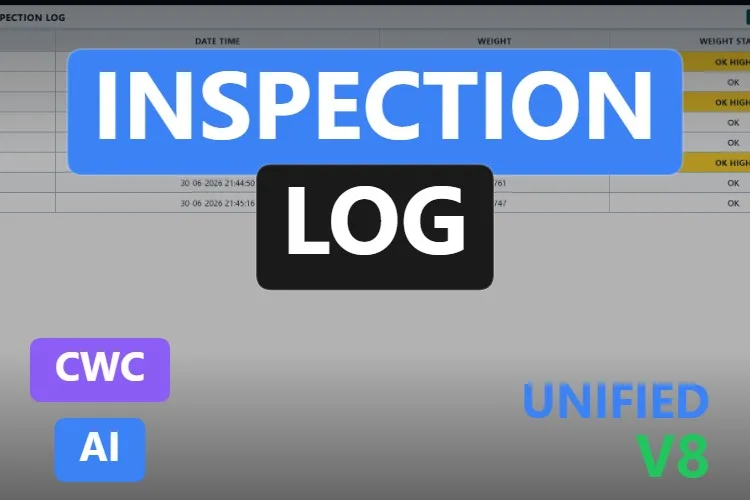
A no-nonsense log straight from a production line. "TUBE WEIGHT INSPECTION LOG" heads a light, bordered table with tube number, date and time, weight and weight status for tubes 101 to 108. Weights hover around 17.7 to 17.9, and the three marked "OK HIGH" get a bright yellow cell, so they jump out at once. A "STANDALONE / READY" badge in the corner shows the connection state.
Its sheet counts 7 properties and names them all: recordsJson takes the records (for example the result of a SQL query), maxDisplayedRows keeps the view short, titleText and connectionStatusText label it, headerColor and backgroundColor set the palette, and highlightHighWeightColor picks the warning colour. RowSelected and RefreshRequested talk to your scripts, while appendRecord adds live results one at a time and clearRecords starts a new session.
What we like
- Out-of-tolerance results are impossible to miss
appendRecordfor live streaming from a checkweigher- Classic, printable look that quality teams like
Keep in mind
- Made for weights: other inspections mean renaming columns, and the weight column shows no unit
- Its sheet speaks of highlighted rows, but in the preview only the status cell turns yellow
Bindable properties
- recordsJson
- maxDisplayedRows
- titleText
- connectionStatusText
- highlightHighWeightColor
- headerColor
- backgroundColor
08Crowd favourite: the most flexible (Tabulator)
Custom table
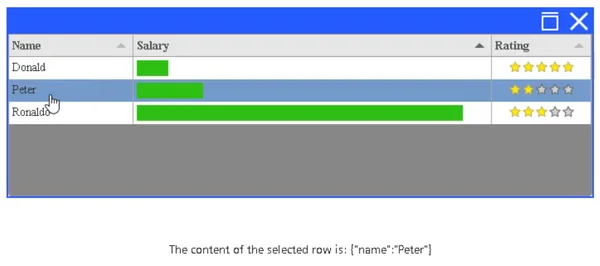
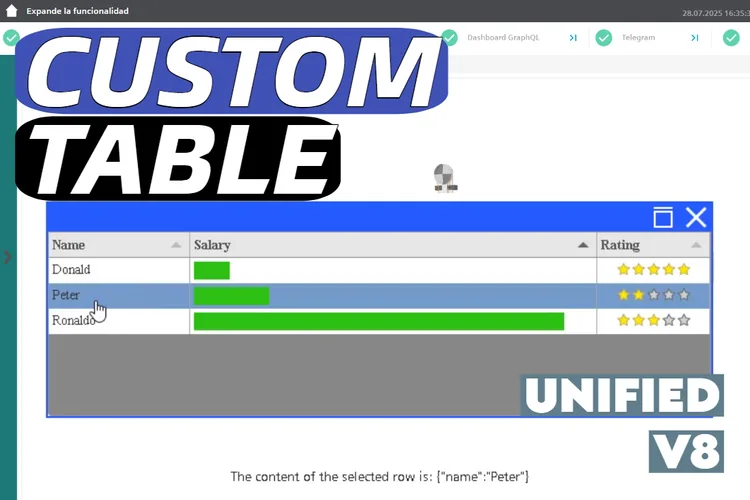
The veteran of the list, published in July 2025, and the most downloaded table in the catalogue with 45 downloads in November 2026. The preview is a demo, not a plant screen: a window with a blue title bar holds Name, Salary and Rating columns for Donald, Peter and Ronaldo, with green progress bars and star ratings. Peter's row is selected, and a line underneath echoes the click: "The content of the selected row is: {"name":"Peter"}".
What it lacks in looks it makes up for in reach. According to its sheet it is built on Tabulator, a well-known open-source table library, so filtering, column formatters and dynamic styling are all there. You feed it through two properties, TableDataString for the rows and ColumnStyleString for the column definitions, and a click event tells your script which row and column were clicked, ready to open a popup or change screen. The download includes an example project and integration instructions in English.
What we like
- Tabulator underneath: formatters, filters and sorting with documentation online
- Row and column click event for drill-down
- Example project included, and the most downloaded table
Keep in mind
- Dated look and demo data in the preview: plan to restyle it
- You write the column definitions as a JSON string, which takes some reading of the Tabulator docs
Bindable properties
- TableDataString
- ColumnStyleString
Honourable mention: one more table worth a look
A good-looking control that did not make the top eight because its product sheet does not name its properties. Click the thumbnail to open its product page.

Modern table
An asset monitor with live clock, global performance and alert counters, and a table of devices with status badges, temperature, load bars, health and a "VER" button. The preview texts are in Spanish, and the sheet counts 14 properties, 2 events and 2 methods without naming them.
View product
Didn't find your table? Make your own (or remix one) with AI, for free
A confession: every data table in this article was created with the HMIx AI generator. That is why we can say this without blushing: if none of them shows your records the way you need, you can generate your own in minutes.
Describe the table in plain words (for example, "table of the last 50 production orders with order number, product, quantity, progress bar and a red row when an order is late, with search and a row click event") and the generator walks you through it step by step: the design, the properties, events and methods you will use in WinCC, a simulation to try values and the final Custom Web Control package for WinCC Unified and WinCC V8. The same tool also builds dynamic SVGs when a lightweight drawing is all you need.
- Remix any table on this list: on its product page, the "Edit in AI Generator" button opens it straight in the generator, ready for you to ask for changes such as "remove the italics", "add a unit to the weight column" or "colour the whole row on a failure". The "Edit it with AI" links in this article do the same.
- Free to try: you can start without an account, with a small daily allowance of credits, and the Community plan is free.
- The result is yours to use: download the package and add it to your TIA Portal project like any other table on this page.
How to use a data table Custom Web Control in WinCC Unified (and WinCC V8)
The short version, for when you have already picked your table. Our Custom Web Control guide covers every step with diagrams and screenshots.
Download the ZIP
Open the product page, sign in with your free account and download the table. The downloaded ZIP contains the documentation and, inside it, the control package named
{GUID}.zip: that inner file is the one you need.Copy it into your TIA Portal project
Copy the
{GUID}.zipfile, still compressed, into your project folder underUserFiles\CustomControls(create both folders if they do not exist). Do not extract it.Refresh My controls and drag it in
In TIA Portal, open the Tools task card, expand My controls and click Update. The table appears in the list: drag it onto your screen and give it room for its columns.
Bind and test the properties
Select the control and open Inspector window → Properties → Properties → Interface. These tables take their rows as a JSON string (
dataJson,historicalData,recordsJson,TableDataString…), so start with an internal string tag and a small test script that writes two or three rows, then start Runtime. Untick Read only on properties the control writes back, such asselectedRowIndexorpageIndex. Once the rows look right, switch to your real data.On WinCC V8
Every top pick in this article is tagged as compatible with WinCC V8 on its product page. The package is the same; follow the WinCC V8 documentation for importing and configuring Custom Web Controls in that environment.
Pro tip: send the table only what the operator can read. Use the row limits these controls offer (rowsPerPage, pageSize, maxDisplayedRows, maxPreviewRows) and, for large data sets, query one page at a time like the Paginated Records Table does. A JSON string with thousands of rows rewritten every second is heavy work for a Unified Comfort Panel and useless for the person in front of it.
Frequently asked questions
Are these data table Custom Web Controls really free?
Yes. Every table in this article is published as a free product on HMIx. You only need a free account to download them.
Why use a Custom Web Control for a table in WinCC Unified?
The standard WinCC objects are built for specific data, such as alarms, trends or parameter sets. When you want a grid of your own records, such as production orders, batches, quality checks or the result of a database query, with search, paging, status colours and a row click event, a data table Custom Web Control gives you that grid ready to bind.
How do I send rows to the table?
Most of these tables take their rows as a JSON string in a property such as dataJson, historicalData, recordsJson or TableDataString. Build that string in a WinCC script, or bind a string tag that something else fills, and check the exact format in the documentation included in the download.
Can a Custom Web Control read my SQL Server database?
Treat database access as part of your project, not of the control. The SQL-oriented tables in this list expose query and connection properties, events such as RefreshRequested or PageChanged, and methods such as setTableData so that your scripts or a server-side connector run the queries and hand the results to the table. Read the documentation of the control you pick, use a read-only database user where you can, and never store a database password in a tag operators can read.
Do they work on WinCC Unified Comfort Panels and on WinCC V8?
Their product pages list compatibility with WinCC Unified, including Unified Comfort Panels, and with WinCC V8. As with any AI-generated control, test the behaviour in your own project and on your target device before going into production, especially with the number of rows you plan to show.
Can I modify one of these tables?
Of course. You can edit the HTML, CSS and JavaScript of the control yourself, or press "Edit in AI Generator" on the product page and ask for the changes in plain language. The second option is usually faster, because the generator takes care of the interface and the packaging.
Our verdict
If you only download one, make it the Dynamic Data Table: search, paging and CSV export in a calm grid you will have bound in minutes. For a SQL Server editor, Table SQL Server; for quality, the Quality Control Log; for a short list of live values, the Data Table; for big batch histories, the Paginated Records Table; for "I need it in Excel", the Historical Data CSV Exporter; for a checkweigher, the Inspection Log; and when you want Tabulator's full toolbox, the Custom table.
And if your records need a table none of these draws (they always do), remember that the generator that built them is just one click away.