HMIx practical guides
Build a pie chart Custom Web Control for WinCC Unified
A pie chart makes it easy to compare the output of several production lines. Build one with HTML, CSS and JavaScript, add it to TIA Portal and try it with three internal tags.
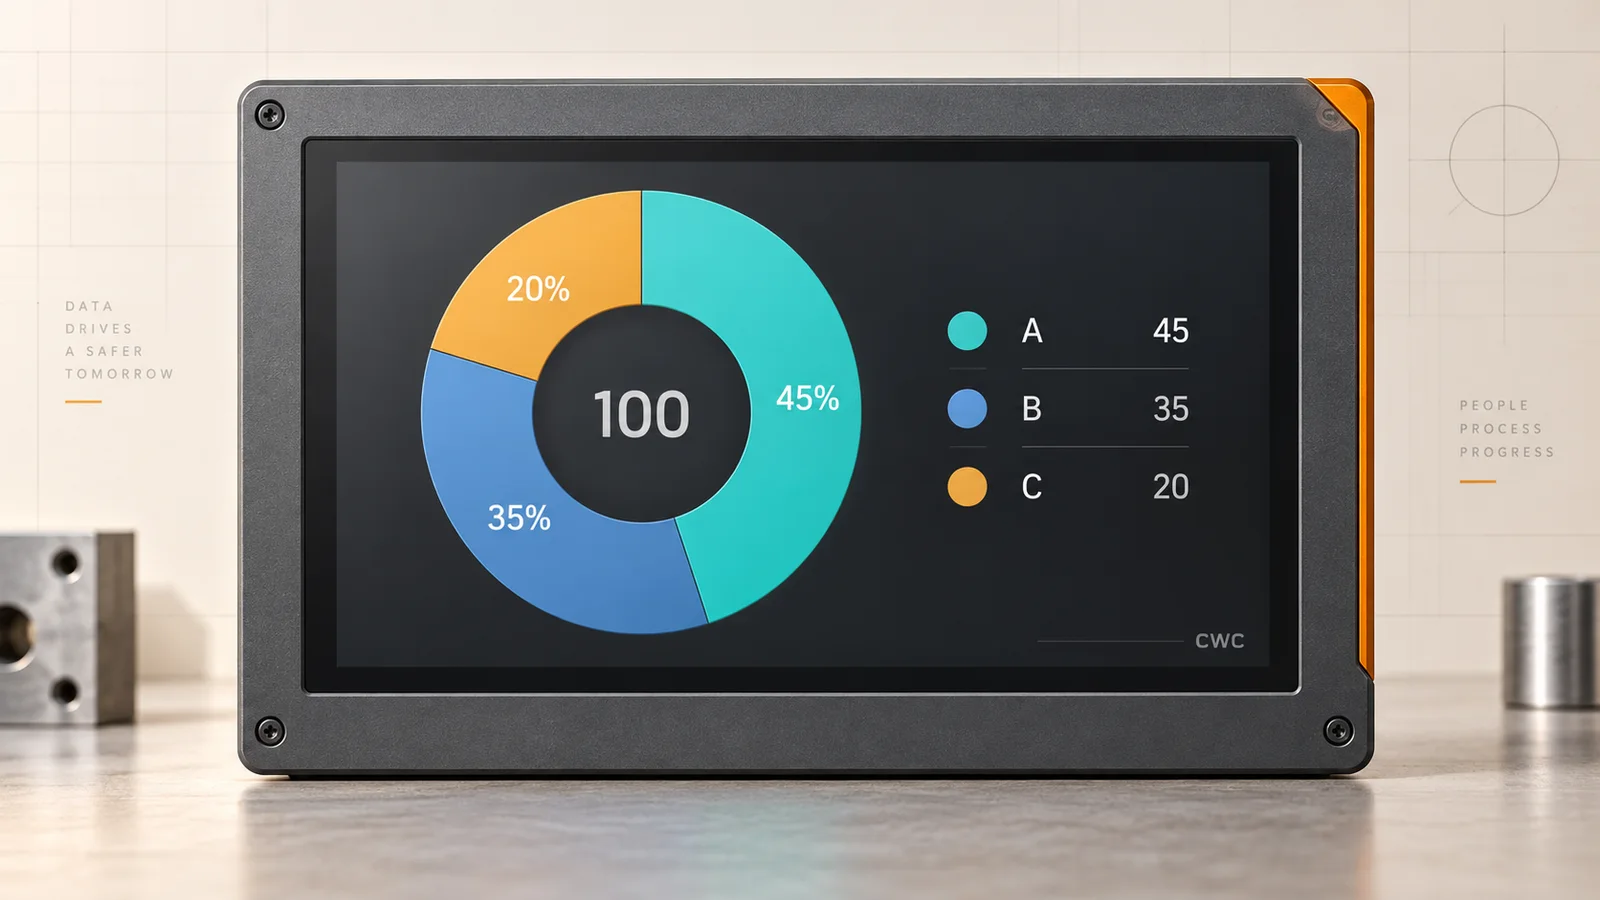
Guide environment: TIA Portal / WinCC Unified V21.1. Check the example’s import and operation on your target device.
What is a Custom Web Control?
A Custom Web Control, usually called a CWC, is a small web component you place inside a WinCC Unified screen. HTML defines its content, CSS defines its appearance and JavaScript makes it react. It is useful when a standard HMI object does not provide the presentation or interaction you need.
Think of a production dashboard, a table or a pie chart. The control exposes properties: named inputs such as ValueA. In TIA Portal, you link each property to an HMI tag; the CWC receives the values and updates the chart. It does not connect directly to the PLC on its own.
- Choose a CWC for custom interactions, several coordinated values or a specialised layout.
- For a single symbol that changes colour, position or fill level, a dynamic SVG is often the simpler choice.
- For a reusable assembly of standard HMI objects, consider a faceplate.
HMIx offers hundreds of free HMI resources to download. Start with a control from the catalogue, or describe your idea to the HMIx AI generator and create a resource you can adapt to your project.
Before you begin
Use a test project with a WinCC Unified device and an empty screen. You need TIA Portal with WinCC Unified Engineering and the matching Runtime or simulation components installed. A standard Comfort project and a Unified project are different targets.
- For the first test, use Unified PC Runtime or the simulation supported by your Unified device.
- Have a text editor and a ZIP utility available if you want to change the example. Visual Studio Code is convenient, but not required.
- No PLC is needed: three internal HMI tags and three I/O fields provide the test values.
The browser preview checks the drawing. Only a test inside Unified verifies the WebCC connection and tag binding.
Build a three-value pie chart
Our pie chart has a hole in the middle: the total sits in the centre and each series appears in the legend. Its inputs are ValueA, ValueB and ValueC, initially 45, 35 and 20. These are amounts; they do not have to add up to 100. The control calculates each share of the total.
Create the files
Create manifest.json at the root and two folders: assets and control. Inside control, create index.html and code.js. Obtain Siemens' webcc.min.js from the official example linked below and place it in control too. Each file has a specific role; no web framework is needed.
Define the three inputs
In manifest.json, declare ValueA, ValueB and ValueC as numbers with defaults of 45, 35 and 20. The manifest also specifies the HMIx Pie Chart name, its identity and its entry file.
Draw the chart and legend
In control/index.html, add a ring with three segments, the total and the A, B and C legend. In code.js, calculate each share by dividing its value by the sum. When all three values are zero, display an empty ring. The example uses SVG inside HTML and needs no chart library.
Connect it to Unified
Load Siemens webcc.min.js unchanged. Start WebCC with the same three properties, read their values when connected and redraw whenever onPropertyChanged reports a change. This also displays the current data when the screen opens.
Package the contents
Place manifest.json, assets and control at the ZIP root, without an extra enclosing folder. Name the ZIP with the control's GUID in braces. If you edit our files, rebuild the ZIP with the same structure; changing the outer filename alone does not create a new control identity.
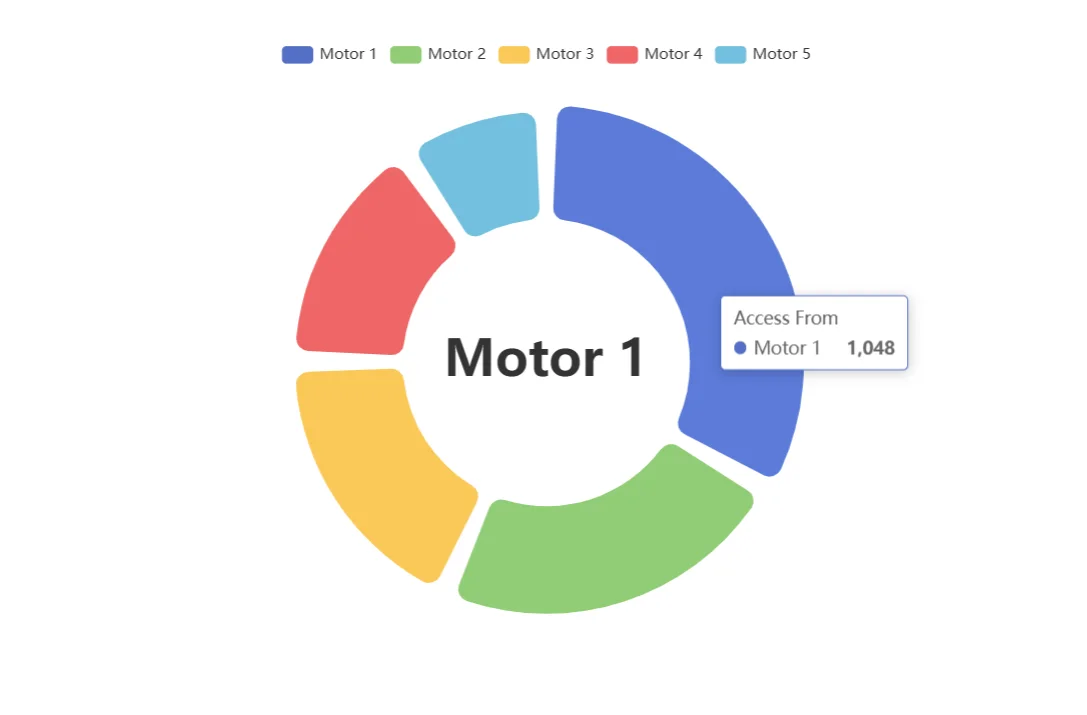
ValueA, ValueB and ValueC must match in the manifest and JavaScript. This guide’s download is an original example with three inputs; the catalogue Pie Chart uses Apache ECharts and five elements with Value and Title.
Complete ZIP with three numeric inputs and WebCC. Code and structure checked; verify importing and connecting it in WinCC Unified V21.1.
View the example code
Optional: the download contains the complete example. You do not need to type this code to follow the test.
manifest.json
{
  "mver": "1.2.0",
  "control": {
    "identity": {
      "name": "HmixPieChart",
      "version": "1.0",
      "displayname": "HMIx Pie Chart",
      "type": "guid://8D821B43-4EF5-4BF1-A31D-931D283C7C04",
      "start": "./control/index.html"
    },
    "metadata": {
      "author": "HMIx",
      "description": "Educational read-only three-value pie chart"
    },
    "contracts": {
      "api": {
        "methods": {},
        "events": {},
        "properties": {
          "ValueA": { "type": "number", "default": 45 },
          "ValueB": { "type": "number", "default": 35 },
          "ValueC": { "type": "number", "default": 20 }
        }
      }
    },
    "types": {}
  }
}
control/index.html
<!doctype html>
<html lang="en">
  <head>
    <meta charset="utf-8" />
    <meta name="viewport" content="width=device-width, initial-scale=1" />
    <title>HMIx Pie Chart</title>
    <style>
      * {
        box-sizing: border-box;
      }
      body {
        margin: 0;
        padding: 20px;
        background: #171e26;
        color: #f3f5f6;
        font:
          14px system-ui,
          sans-serif;
      }
      header {
        display: flex;
        justify-content: space-between;
        color: #bac5ce;
        font-size: 11px;
        letter-spacing: 0.14em;
      }
      main {
        display: flex;
        align-items: center;
        justify-content: center;
        gap: 24px;
        min-height: 240px;
      }
      svg {
        width: 55%;
        max-width: 300px;
        flex-shrink: 0;
      }
      ul {
        list-style: none;
        padding: 0;
        min-width: 110px;
      }
      li {
        display: grid;
        grid-template-columns: 10px 1fr auto;
        align-items: center;
        gap: 10px;
        padding: 14px 0;
        border-bottom: 1px solid #35404a;
      }
      .dot {
        width: 8px;
        height: 8px;
        border-radius: 50%;
      }
      small {
        display: block;
        margin-top: 4px;
        color: #bac5ce;
        font-variant-numeric: tabular-nums;
      }
      strong {
        font-variant-numeric: tabular-nums;
      }
      @media (max-width: 360px) {
        body {
          padding: 12px;
        }
        main {
          gap: 12px;
        }
      }
    </style>
  </head>
  <body>
    <header><span>HMIx</span><span>PIE CHART</span></header>
    <main>
      <svg viewBox="0 0 220 220" role="img" aria-labelledby="chart-title">
        <title id="chart-title">Distribution of A, B and C</title>
        <circle
          cx="110"
          cy="110"
          r="76"
          fill="none"
          stroke="#35404a"
          stroke-width="28"
        />
        <g transform="rotate(-90 110 110)" fill="none" stroke-width="28">
          <circle id="ValueA" cx="110" cy="110" r="76" stroke="#47d2c8" />
          <circle id="ValueB" cx="110" cy="110" r="76" stroke="#79a9ed" />
          <circle id="ValueC" cx="110" cy="110" r="76" stroke="#f5c16c" />
        </g>
        <text
          id="total"
          x="110"
          y="115"
          text-anchor="middle"
          fill="#f3f5f6"
          font-size="30"
          font-weight="600"
        >
          100
        </text>
        <text
          x="110"
          y="139"
          text-anchor="middle"
          fill="#bac5ce"
          font-size="10"
          letter-spacing="2"
        >
          A + B + C
        </text>
      </svg>
      <ul aria-label="Values and shares">
        <li>
          <i class="dot" style="background: #47d2c8"></i
          ><span>A<small id="ValueA-amount">45</small></span
          ><strong id="ValueA-percent">45%</strong>
        </li>
        <li>
          <i class="dot" style="background: #79a9ed"></i
          ><span>B<small id="ValueB-amount">35</small></span
          ><strong id="ValueB-percent">35%</strong>
        </li>
        <li>
          <i class="dot" style="background: #f5c16c"></i
          ><span>C<small id="ValueC-amount">20</small></span
          ><strong id="ValueC-percent">20%</strong>
        </li>
      </ul>
    </main>
    <script src="webcc.min.js"></script>
    <script src="code.js"></script>
  </body>
</html>
control/code.js
/* HMIx educational pie chart. Values are amounts, not required percentages. */
var values = { ValueA: 45, ValueB: 35, ValueC: 20 };
var keys = ['ValueA', 'ValueB', 'ValueC'];
var circumference = 2 * Math.PI * 76;

function drawChart() {
  // Normalize before adding to avoid overflow for very large finite values.
  var maximum = Math.max(values.ValueA, values.ValueB, values.ValueC, 1);
  var sum = keys.reduce(function (n, key) {
    return n + values[key] / maximum;
  }, 0);
  var offset = 0;
  keys.forEach(function (key) {
    var fraction = sum ? values[key] / maximum / sum : 0;
    var arc = document.getElementById(key);
    var length = fraction * circumference;
    arc.setAttribute('stroke-dasharray', length + ' ' + circumference);
    arc.setAttribute('stroke-dashoffset', String(-offset));
    arc.setAttribute('visibility', fraction ? 'visible' : 'hidden');
    document.getElementById(key + '-amount').textContent = String(values[key]);
    document.getElementById(key + '-percent').textContent =
      Math.round(fraction * 100) + '%';
    offset += length;
  });
  var total = values.ValueA + values.ValueB + values.ValueC;
  document.getElementById('total').textContent = isFinite(total)
    ? String(total)
    : '—';
}

function setValue(key, value) {
  if (keys.indexOf(key) === -1 || typeof value !== 'number' || !isFinite(value))
    return;
  values[key] = Math.max(0, value);
}

drawChart();
if (typeof WebCC !== 'undefined') {
  WebCC.start(
    function (connected) {
      if (!connected) return;
      keys.forEach(function (key) {
        setValue(key, WebCC.Properties[key]);
      });
      drawChart();
      WebCC.onPropertyChanged.subscribe(function (change) {
        setValue(change.key, change.value);
        drawChart();
      });
    },
    {
      methods: {},
      events: [],
      properties: { ValueA: 45, ValueB: 35, ValueC: 20 },
    },
    ['HMI'],
    10000,
  );
}
Siemens · Manifest structureSiemens · WebCC and the Runtime interfaceSiemens · Example files and WebCC library
Add the ZIP to your TIA Portal project
Find the project folder
Open the folder containing your TIA Portal project. Inside UserFiles, create CustomControls if it does not exist.
Copy the CWC package
Put the importable {GUID}.zip in UserFiles\CustomControls. Keep this ZIP compressed. Do not copy only index.html or an outer download bundle.
Refresh and place the control
Open the Unified screen. In Tools → My controls, click Refresh and drag HMIx Pie Chart onto the screen. Allow room for the ring and its legend, for example 480 × 300 pixels.
Check its interface
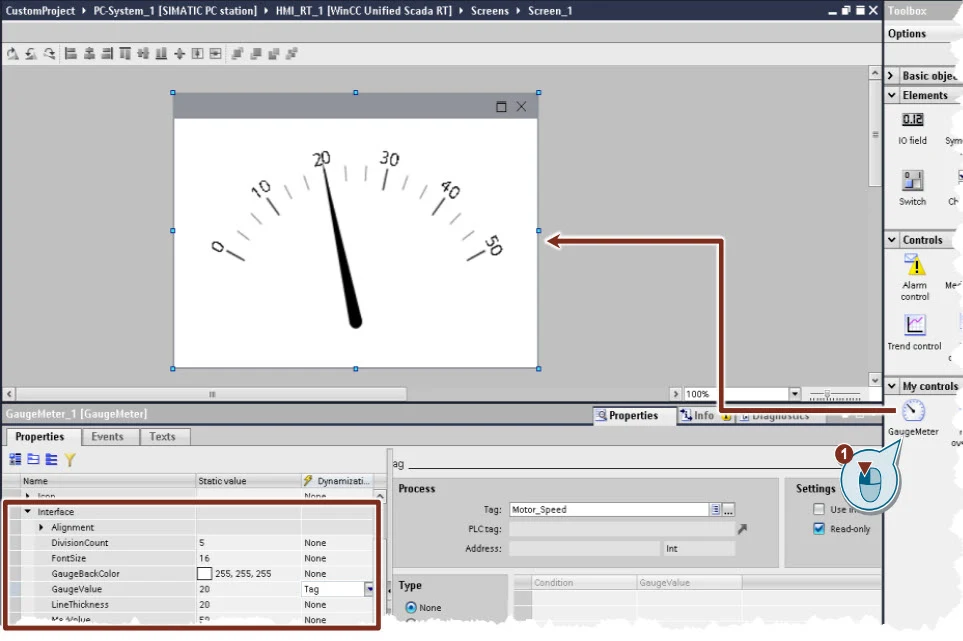
Select the control and open Properties → Properties → Interface. Find ValueA, ValueB and ValueC and assign static values of 45, 35 and 20. Next, you will link them to tags.
Test it with three internal tags, without a PLC
Create three internal tags
In the HMI tag table, add ProductionA, ProductionB and ProductionC using a numeric type such as Real and no PLC connection.
Link each input to its tag
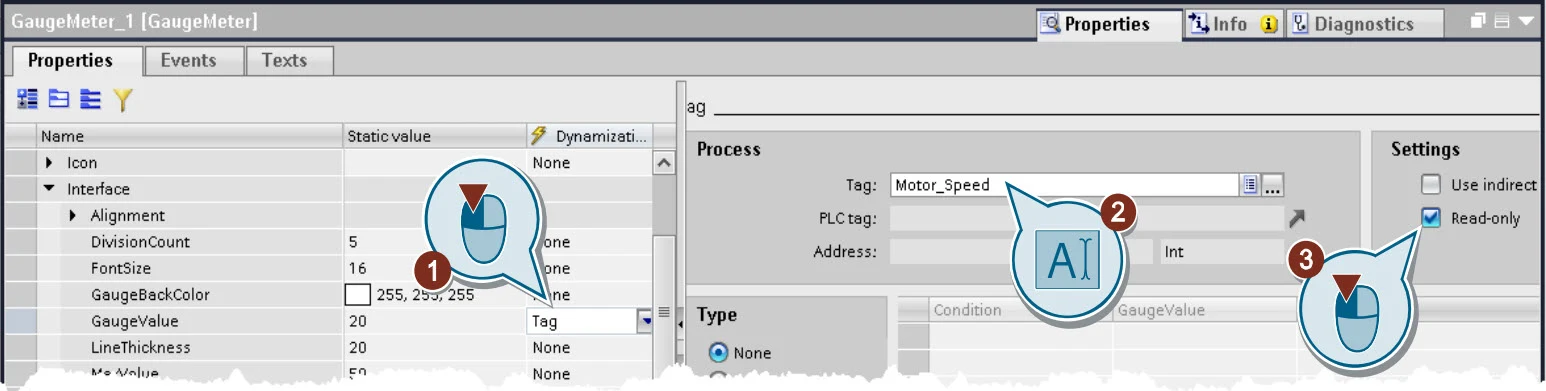
In the CWC interface, choose Tag for dynamization: ValueA → ProductionA, ValueB → ProductionB and ValueC → ProductionC. Keep Read only enabled; the I/O fields will change the data.
Add three I/O fields
Add an I/O field in input/output mode for each tag. Label them A, B and C. For this test, use amounts between 0 and 100 and set input limits where available.
Compile and run
Set this as the start screen, compile the HMI and fix any reported errors. Start the supported HMI simulation, or load and start your test project in Unified PC Runtime. Open the Runtime client and sign in with the test project's configured user if requested.
Try two distributions and the empty state
Enter 45, 35 and 20, confirming each entry. Then change A to 90: its segment grows and the total becomes 145. Finally, set all three to zero; the ring should be empty. Reopen the screen to check that it shows the current values.
First, see what should happen
Change A, B or C and watch the segments respond. The inputs are amounts; the chart calculates their percentages.
Your test is successful when…
45 / 35 / 20 gives a total of 100. With A = 90, the total is 145 and A accounts for about 62%. Three zeros leave an empty ring. Reopening the screen should show the current values.
Siemens · Installing and using a CWCSiemens · CWC engineering example and original screenshots
If something does not work
- The control is missing: check UserFiles\CustomControls, the ZIP root, valid manifest JSON and the GUID filename, then refresh My controls.
- The chart appears but does not change: check ValueA, ValueB and ValueC, their tags and the WebCC connection. Opening the HTML locally checks the appearance, not the Unified connection.
- It works on PC but fails on a Unified Comfort Panel: keep dependencies inside the package. Siemens documents restrictions on external links and on loading external data with fetch or XMLHttpRequest.
- A change is not visible: rebuild the ZIP, use TIA Portal's control update workflow, compile and reload the test project. Keep a backup of the working version.
Once this small test works, add one feature at a time. Validate the final control on the actual device before connecting it to a real process.
Frequently asked questions
Do I need to know JavaScript?
You can import and bind an existing CWC without writing JavaScript. To change its behaviour by hand, basic HTML, CSS and JavaScript help. HMIx AI can prepare the files; you still review and test the result in Unified.
Can I reuse the control in another project?
Copy its importable ZIP into the other project's UserFiles\CustomControls and configure that project's tags. Keep the package and its version together; do not assume it behaves like a versioned faceplate library type.
Does a working preview mean the control is ready?
It confirms appearance, not the full Runtime integration. Also test startup, property changes, the target device and the expected screen sizes.