Blog · Custom Web Controls
The 10 best KPI card and status indicator Custom Web Controls for WinCC Unified and WinCC V8 (free)
We opened every KPI card, counter and status indicator Custom Web Control in the HMIx catalogue in early November 2026, seventeen candidates, looked at each preview up close, read every product sheet and kept the ten we would happily put on a WinCC Unified or WinCC V8 overview screen. All free, all packaged as a CWC ZIP, and each one the best at a different job: from a single KPI tile to a signal tower.
- Custom Web Control
- CWC
- WinCC Unified
- WinCC V8
- TIA Portal
- KPI card
- Status indicator
- SCADA widgets
Quick picks
Short on time? Jump straight to the card or indicator you need.
- 01Best overall: the classic KPI tileKPI Indicator
- 02Best full KPI dashboard (cycle times and throughput)Crane Logistics KPI
- 03Best for a process value with setpoint and alarm limitsProcess Status Indicator
- 04Best for scrap and reject countersRejected Parts Counter
- 05Best for runtime hours and maintenanceMachine Hour Counter Card
- 06Best plant floor overviewMachine Status Grid
- 07Best for state history (availability timeline)Status Bar
- 08Best signal tower (stack light)Status Lights
- 09Best minimal value cardSquare Info Card
- 10Best single status LEDStatus LED
Why a KPI card Custom Web Control is worth it
Every overview screen ends up with the same handful of questions. Is the line running? How far are we from target? How many parts did we reject this shift? How many hours has that robot done since its last service? A trend answers "how did we get here"; a KPI card or a status indicator answers "where are we now", in one number or one colour, readable from the other side of the control room.
You can build that from rectangles, I/O fields and a lot of dynamisation, and most of us have. A KPI card Custom Web Control (CWC) packs the number, the unit, the trend arrow, the limits and the status colours into one object you drop on the screen and bind. A CWC is a small web application, HTML, CSS and JavaScript packaged as a ZIP, that WinCC Unified (TIA Portal) and WinCC V8 run inside the screen. Its properties appear in the Interface list like any other, so a tag such as rejectCount or isActive drives it directly, and its events, such as Clicked, let your HMI scripts open a faceplate or a detail screen.
What makes a KPI card or status indicator worth downloading
Before the list, the yardstick. This is what we looked for, roughly in order of how much it annoys us when it is missing:
- Readable at three metres. One big number, a clear unit and a label in plain words. If the operator has to lean in, the card has failed.
- Colour that means something. Green, amber and red tied to a state, a limit or a threshold, not decoration. A status indicator that is always the same colour is just a sticker.
- Context in the card. A trend arrow, a setpoint, warning and alarm limits or a small history turn a number into information.
- A clean interface. Properties with clear names on the product sheet, so you know what each tag will drive, plus an event or two for drill-down.
- The right indicator for the job. A KPI tile, a KPI dashboard, a process value with limits, a reject counter, an hour meter, a plant overview, a state timeline, a signal tower, a minimal card and an LED: we picked one champion per job.
How we picked them (and what we did not do)
We searched the HMIx catalogue in early November 2026 for every free Custom Web Control built to show one value or one state at a glance: KPI cards and tiles, counters, status cards, status lights, LEDs and status overviews. Gauges, bar charts, trends and data tables already have their own articles, so the sparkline tiles we covered with the trend charts were left out here. For each candidate we looked at its real preview (not the catalogue cover with the big title on top) and read its product sheet to see which properties, events and methods it documents. Downloads only worked as tie-breakers.
Two controls went to the honourable mentions, and two Motor Status Cards were discarded because their galleries only show the control's icon, so there is nothing to judge. Where a gallery published a small card in the middle of a huge empty canvas, we cropped the empty background for this article, without touching the drawing. And a fair warning: we judged previews and documentation; we did not run these controls in a live Runtime. They were generated with AI and every product page reminds you to test them in your own TIA Portal project before production.
The 10 best KPI card and status indicator Custom Web Controls, one by one
Each entry shows the real preview, what we liked, what to keep in mind and the properties named on its product sheet, followed by the catalogue thumbnail: click it to open the product page and download the control for free.
01Best overall: the classic KPI tile
KPI Indicator
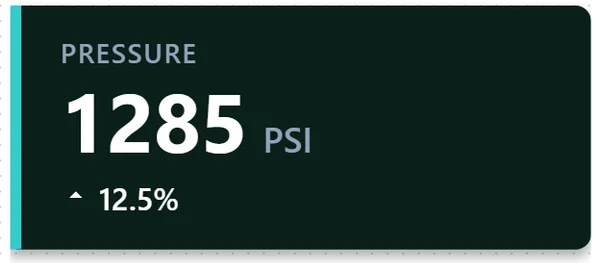
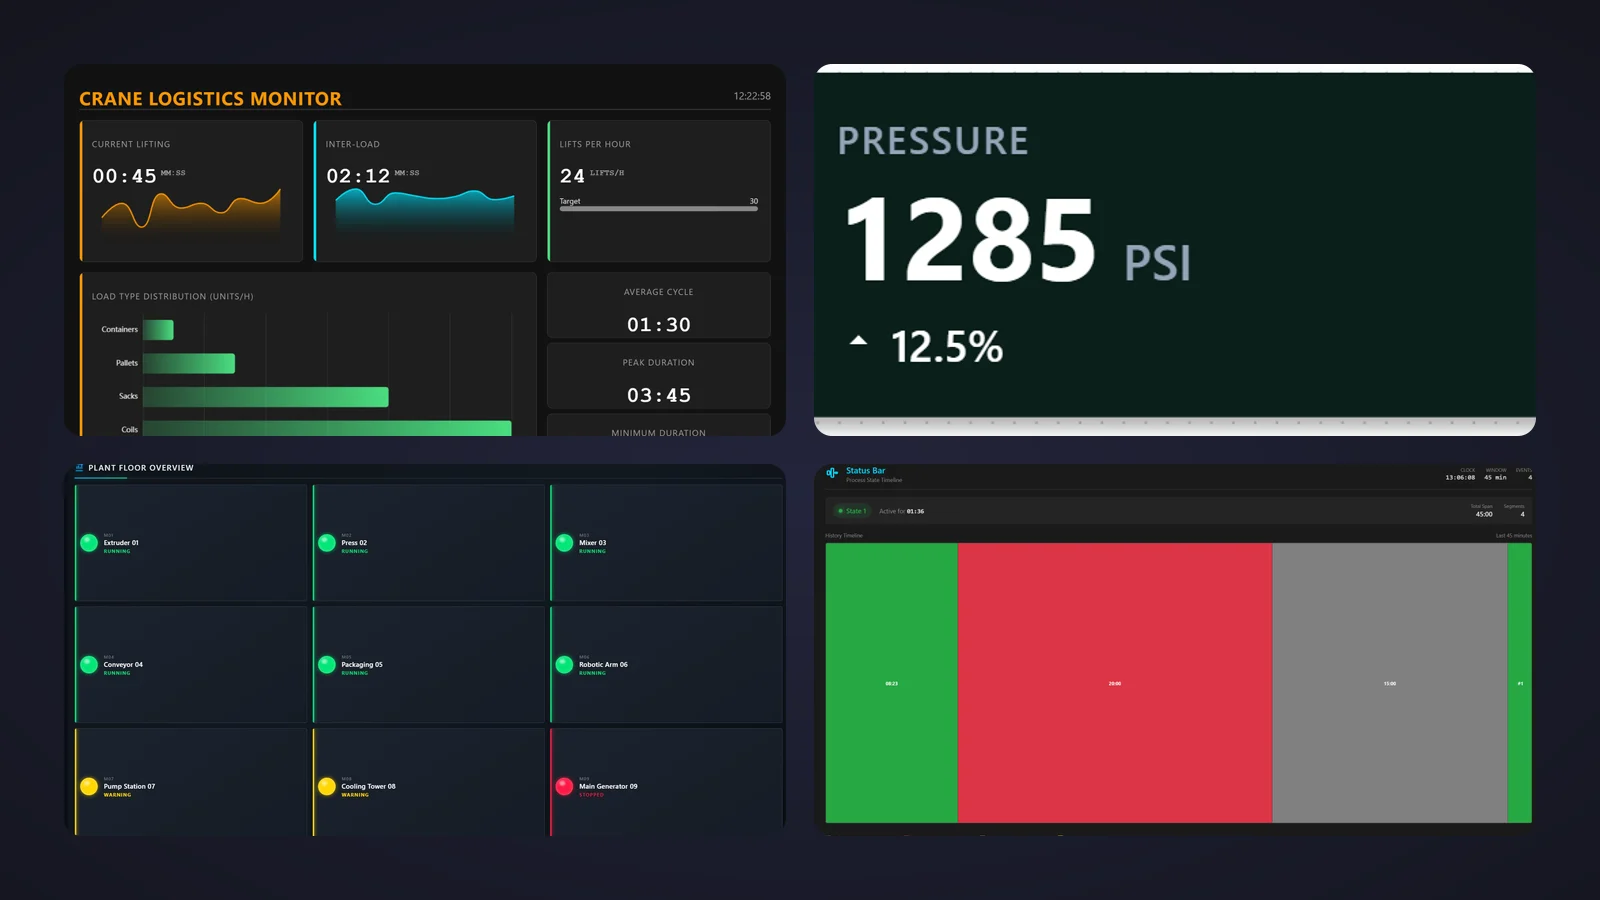
If we could only keep one, it would be this one. A wide tile with a coloured accent bar on its left edge, a small grey label ("PRESSURE"), a huge white value ("1285") with its unit beside it ("PSI") and, underneath, an arrow with a percentage ("▲ 12.5%"). It is exactly what a KPI card should be: one number you can read from across the room and one line of context. With 9 downloads and a five-star review in November 2026, it is also one of the most popular controls in this list.
Its gallery shows three looks of the same control: dark green with a cyan bar, dark grey with a yellow bar and an orange falling arrow, and navy with no trend line at all. That is the interface at work. label and unit name the value, decimalPlaces sets the resolution, trendValue and trendDirection drive the arrow, showTrend hides it, and accentColor, trendColor and backgroundColor carry your state colours. A Clicked event is ready for drill-down to a faceplate or a trend screen.
What we like
- Huge, legible value with its unit: the textbook KPI tile
- Trend arrow and percentage you can switch off
- Accent and trend colours you can bind to a state
Keep in mind
- Its sheet counts 10 properties and names nine: check the Interface list in TIA Portal for the one that carries the value
- One value per tile: for a full KPI row, place several
Bindable properties
- label
- unit
- decimalPlaces
- trendValue
- trendDirection
- showTrend
- accentColor
- trendColor
- backgroundColor
02Best full KPI dashboard (cycle times and throughput)
Crane Logistics KPI
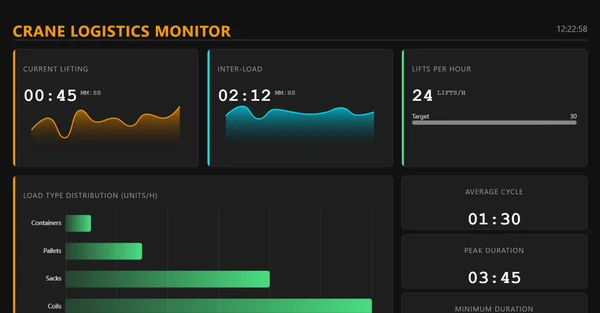
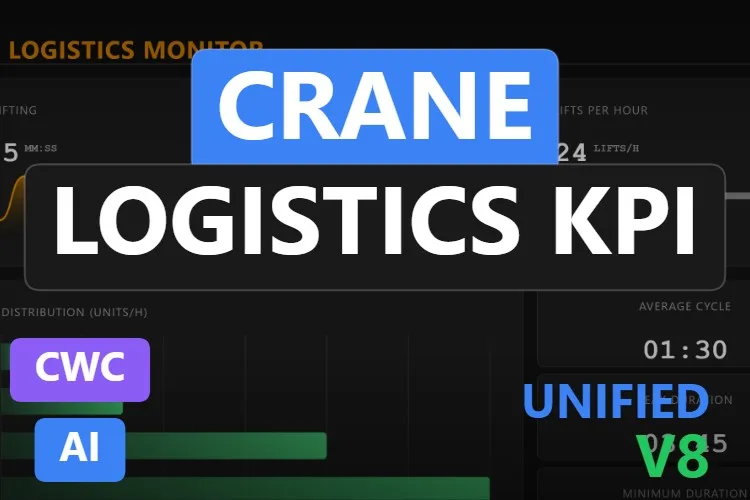
When one card is not enough. "CRANE LOGISTICS MONITOR" in orange heads a complete dashboard with a clock in the corner: "Current lifting" at 00:45 with an orange sparkline, "Inter-load" at 02:12 with a cyan one, "Lifts per hour" at 24 against a target of 30, a horizontal bar chart of load types (containers, pallets, sacks and coils) and a column of cycle statistics: average 01:30, peak 03:45 and minimum. It is the most downloaded control in this article, with 12 downloads and a five-star review in November 2026.
Its sheet is unusually thorough: 30 properties. liftingTimeSeconds and interLoadTimeSeconds feed the live cards, the control tracks averageCycleSeconds, maxCycleSeconds and minCycleSeconds, liftingHistory draws the sparklines and loadTypes the distribution. Every caption has its own property, from labelLiftsPerHour to labelDistribution, and accentColor1 to accentColor3 set the palette. The events CycleCompleted, ThresholdAlert and TargetReached, and the methods exportLogisticsData and resetStatistics, complete it.
What we like
- Six KPIs, two sparklines and a bar chart in one object
- Every label renamable, so it adapts beyond cranes
- Events for alerts and targets, plus export and reset
Keep in mind
- Built around crane cycles: other machines mean renaming most of it
- In the preview the progress bar towards the target of 30 shows no visible fill, and the bottom card is cut off
Bindable properties
- liftingTimeSeconds
- interLoadTimeSeconds
- averageCycleSeconds
- maxCycleSeconds
- minCycleSeconds
- liftingHistory
- loadTypes
- labelLiftsPerHour
- labelDistribution
- accentColor1
- accentColor2
- accentColor3
- backgroundColor
03Best for a process value with setpoint and alarm limits
Process Status Indicator
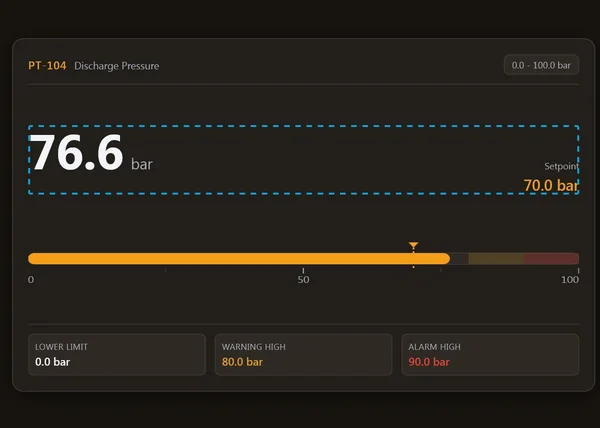
The one that thinks like an instrument engineer. The header reads "PT-104 Discharge Pressure" with a range badge ("0.0 – 100.0 bar"). Below it, the value 76.6 bar in large digits and, on the right, "Setpoint 70.0 bar" in orange. A horizontal bar fills in orange up to the value, with a triangle marking the setpoint and darker amber and red zones at the end of the scale. Three boxes at the bottom spell out the limits: lower limit 0.0 bar, warning high 80.0 bar in amber and alarm high 90.0 bar in red.
Its sheet names nine of its 11 properties: tagId and descriptor identify the measurement, unit, minValue and maxValue define the scale, warningThreshold and alarmThreshold set the limits, decimalPlaces the resolution and backgroundColor the theme. The AlarmTriggered event fires on a limit excursion, and the setValue and setSetpoint methods let a script update it. In short, a mini faceplate for any analog measurement, with the deviation from setpoint visible at a glance.
What we like
- Value, setpoint and limits together, ISA-style tag and descriptor
- Warning and alarm zones drawn on the bar
- An alarm event your scripts can use
Keep in mind
- In the preview a blue dashed outline frames the value row and runs through the "Setpoint 70.0 bar" text
- The sheet does not name the properties for the value and the setpoint (there are
setValueandsetSetpointmethods): check the Interface list before binding
Bindable properties
- tagId
- descriptor
- unit
- minValue
- maxValue
- warningThreshold
- alarmThreshold
- decimalPlaces
- backgroundColor
04Best for scrap and reject counters
Rejected Parts Counter
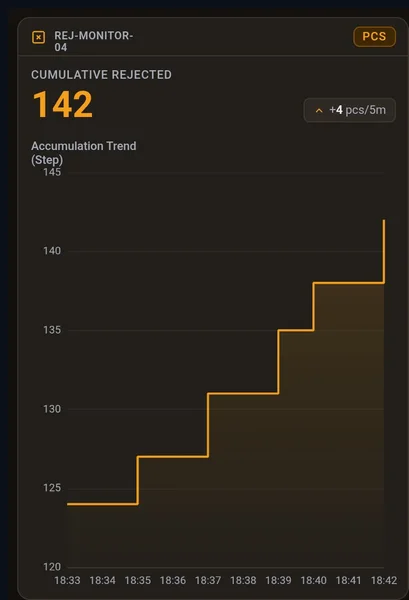
A counter that tells a story. The card, in warm dark tones with an amber accent, names its station ("REJ-MONITOR-04"), shows a "PCS" unit badge, the cumulative rejected count in big amber digits (142) and a small chip with the recent rate ("+4 pcs/5m"). Below it, a step-line chart titled "Accumulation Trend (Step)" climbs from 124 to 142 between 18:33 and 18:42. One look and you know not only how many parts went to scrap, but whether it is getting worse.
Its sheet counts 11 properties and names ten. rejectCount is the main value and deltaRate the recent increment, stationTag identifies the station, maxHistoryPoints sets how deep the trend buffer goes, metricLabel, unitText and chartCaption rename the texts, and accentColor, panelColor and backgroundColor set the palette. It is tall and narrow, a good fit for the side column of a quality or end-of-line screen.
What we like
- Count, rate and history in one card
- Step-line chart that suits counters (no fake slopes)
- Every text renamable for good parts, stops or alarms
Keep in mind
- In the preview the station name wraps onto two lines and the chart caption crowds the top axis value
- Tall format: it needs a column, not a row
Bindable properties
- rejectCount
- deltaRate
- stationTag
- maxHistoryPoints
- metricLabel
- unitText
- chartCaption
- accentColor
- panelColor
- backgroundColor
05Best for runtime hours and maintenance
Machine Hour Counter Card
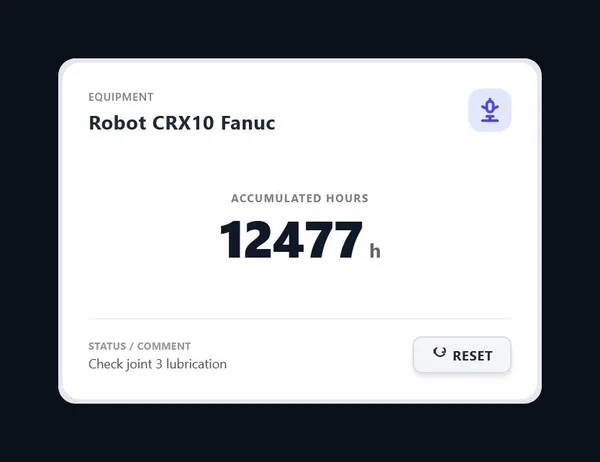
For the maintenance team. A clean white card names the equipment ("Robot CRX10 Fanuc") next to a robot icon, shows "Accumulated hours" in big dark digits (12477 h) and, at the bottom, a status comment ("Check joint 3 lubrication") next to a "Reset" button. It is the hour meter you would print on the machine, with a note for the next shift.
According to its sheet, the hours come straight from a PLC DINT value, and isRunning lights an animated gradient glow on the card border while the machine runs. iconType picks the equipment symbol, resetButtonLabel renames the button, which fires the OnReset event, darkMode switches between dark and light, and backgroundColor matches your screen. The triggerReset method lets a script reset it too. Use it on preventive maintenance screens for motors, pumps, compressors or robots.
What we like
- Clear hour meter with equipment name and maintenance note
- Reset button with its own event, ready for your PLC logic
- Dark and light modes
Keep in mind
- The sheet does not give the exact name of the hours, title and comment properties: check the Interface list, and untick Read only on the tags the reset writes
- The glow for
isRunningis not visible in the published preview
Bindable properties
- isRunning
- iconType
- resetButtonLabel
- darkMode
- backgroundColor
06Best plant floor overview
Machine Status Grid
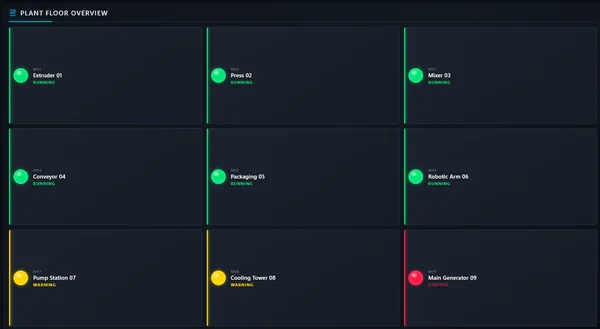
The whole plant on one screen. Under the title "PLANT FLOOR OVERVIEW", a three-by-three grid of tiles, each with a glossy lamp, an ID (M01 to M09), a name and a state: six machines from "Extruder 01" to "Robotic Arm 06" are RUNNING in green, "Pump Station 07" and "Cooling Tower 08" show WARNING in yellow, and "Main Generator 09" is STOPPED in red. Each tile also has a coloured left edge, so the odd one out jumps out even on a wall screen.
Its sheet focuses on layout. Machine Count sets how many tiles are shown, Title Size, Element Size, Indicator Size and ID Label Size tune the typography and the lamps, and Background Color fits it to your theme. It is the kind of control you put on the start screen of an OEM machine or a line, so the operator knows where to look before opening anything else.
What we like
- Instant red-yellow-green picture of a whole line
- Number of machines and sizes adjustable
- Calm, high-contrast dark design
Keep in mind
- The sheet names only layout properties: how each machine's name and state are fed is not described, so read the included documentation before planning tags
- Text is small and most of each tile is empty space in the preview
Bindable properties
- Machine Count
- Title Size
- Element Size
- Indicator Size
- ID Label Size
- Background Color
07Best for state history (availability timeline)
Status Bar
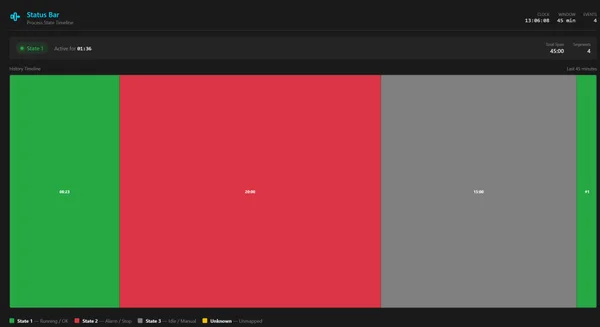
A status indicator with a memory. Titled "Status Bar – Process State Timeline", it shows a clock, a 45-minute window and an event count in the header, a chip saying "State 1 – Active for 01:36" and, below it, a wide timeline of coloured blocks: green, a long red stretch, grey and green again, each with its duration. A legend explains the colours: State 1 running/OK, State 2 alarm/stop, State 3 idle/manual and Unknown.
According to its sheet, it adds a new segment each time the status property changes, keeps a rolling window set by maxHistoryMinutes and grows the active segment smoothly every updateInterval. showTooltips shows the start, end and duration of each block on hover, state1Label to unknownStateLabel rename the states, barHeight and borderRadius shape it and backgroundColor matches your theme. OnStatusChanged and OnHistoryCleared talk to your scripts, and resetHistory and exportHistoryJson manage the record.
What we like
- Shows how long the machine spent in each state, not just the current one
- Hover tooltips with start, end and duration
- JSON export of the history for reports
Keep in mind
- Its sheet describes a timeline built from the changes it receives in a rolling window; it does not mention reading the WinCC archive
- The duration labels inside the segments are tiny in the preview
Bindable properties
- status
- maxHistoryMinutes
- updateInterval
- showTooltips
- state1Label
- unknownStateLabel
- barHeight
- borderRadius
- backgroundColor
08Best signal tower (stack light)
Status Lights
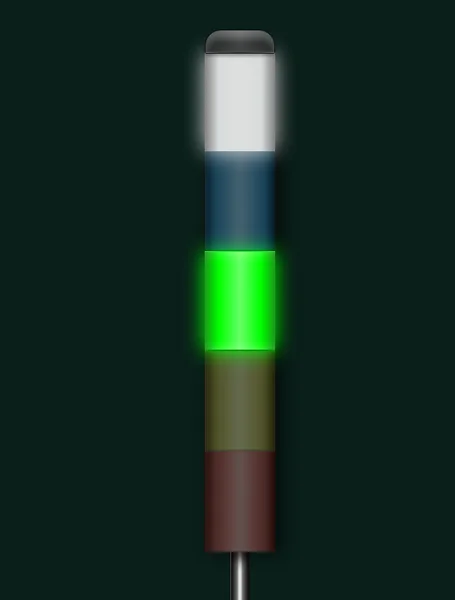
The digital twin of the stack light on top of every machine. A slim tower on a metal pole with five segments, white, blue, green, amber and red from top to bottom, where the lit ones glow and the rest stay dimmed. In the preview the white and green segments are on. Operators understand it instantly, because they see the real one every day. It has 9 downloads and a five-star review in November 2026.
Its sheet describes an unlimited number of levels defined in the segments array. opacityInactive sets how dim the off segments look, showLabels adds a text to each level, and borderWidth, borderColor and backgroundColor adjust the frame. The setSegmentState, setSegmentColor and setSegmentStatus methods switch segments and blinking from your scripts, and the SegmentClicked event can trigger an acknowledgement.
What we like
- Instantly familiar to anyone on the shop floor
- As many segments as you need, with blinking
- Click event per segment
Keep in mind
- The first gallery image shows the tower with every segment off; the second, with lights on, is the one we show
- Driven by an array and methods rather than one Boolean per lamp: plan a small script
Bindable properties
- segments
- showLabels
- opacityInactive
- borderWidth
- borderColor
- backgroundColor
09Best minimal value card
Square Info Card
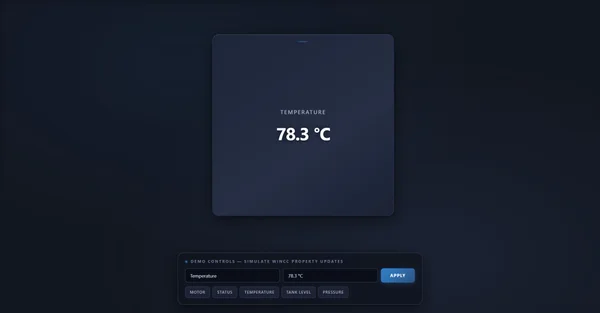
Sometimes less is more. A square, dark blue card with rounded corners shows a small label ("TEMPERATURE") and one value ("78.3 °C") in the middle. Nothing else. Its sheet promises that it keeps its 1:1 shape at any size and adds a smooth hover animation, which makes it a tidy building block for a grid of identical tiles.
Its sheet counts 8 properties and names them all: title and value carry the content, accentColor colours the highlight bar at the top, cardColor and backgroundColor give depth, titleColor and valueColor the text, and borderRadius softens or sharpens the corners. OnCardClicked opens a detail pop-up and updateDisplay lets a script refresh it.
What we like
- Clean, square format that lines up in grids
- Short interface, all eight properties named
- Click event for navigation
Keep in mind
- The preview includes a demo panel to simulate values, so the card itself looks small
- The accent bar at the top is a barely visible line in the preview
Bindable properties
- title
- value
- accentColor
- cardColor
- titleColor
- valueColor
- borderRadius
- backgroundColor
10Best single status LED
Status LED
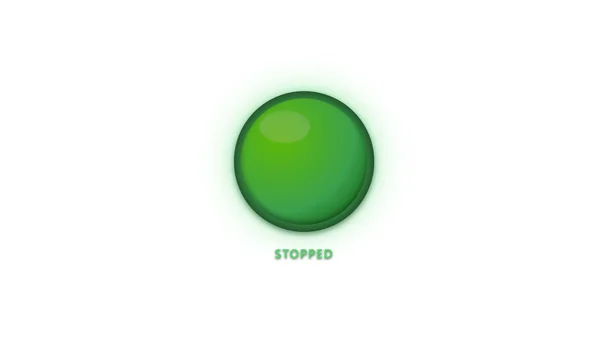
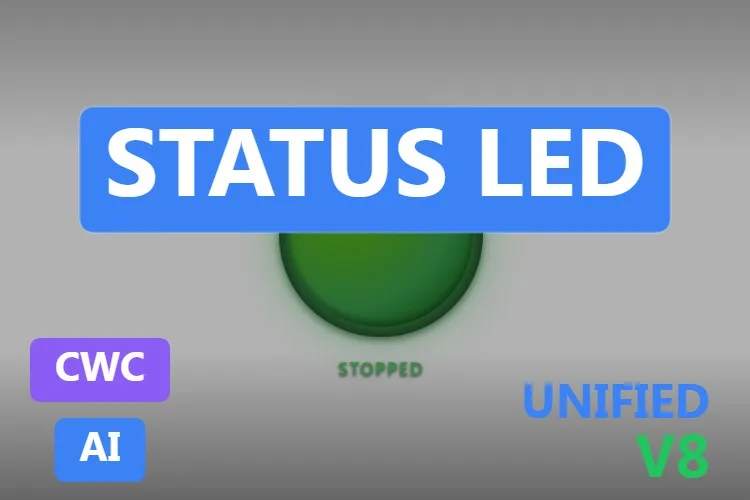
The smallest control in the list, and the most useful on dense screens. A glossy, round LED with a soft glow and a label underneath. It does one thing: tell the operator whether something is on or off, without asking them to read.
Its sheet names all 7 properties. isActive switches the state, activeLabel and inactiveLabel set the text for each, glowEnabled adds a rhythmic pulse and glowIntensity makes it visible in high-glare control rooms, while borderThickness and backgroundColor adjust the look. The toggleState and setState methods and the StateChanged event cover the scripting side.
What we like
- One Boolean in, one clear signal out
- Optional pulse for states that need attention
- Tiny footprint for overview and mimic screens
Keep in mind
- The preview shows a green LED labelled "STOPPED": check which colour each state uses before you trust the default
- White background in the preview: set
backgroundColorfor dark screens
Bindable properties
- isActive
- activeLabel
- inactiveLabel
- glowEnabled
- glowIntensity
- borderThickness
- backgroundColor
Honourable mentions: two more indicators worth a look
Two controls that did not make the top ten because of their previews. Click the thumbnail to open the product page.
State List Indicator
A light list titled "System Status" with System Ready, Process Running, Emergency Stop and Cooling Active, each with a status badge, an active-state counter and a
View productStateClickedevent. The preview is a small list in a large, mostly empty canvas.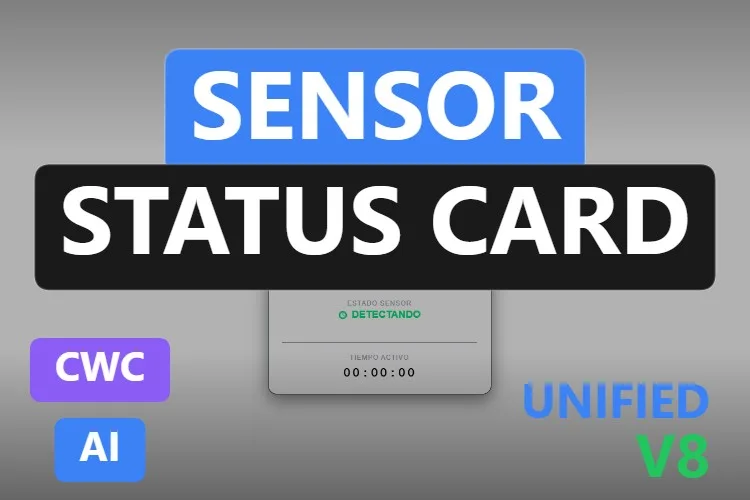
Sensor Status Card
A compact light sensor card with a ring showing luminosity in %, a state with its icon, an auto badge and a runtime timer with a
View productresetTimermethod. The preview texts are partly in Spanish and the card is tiny.
Didn't find your indicator? Make your own (or remix one) with AI, for free
A confession: every KPI card and status indicator in this article was created with the HMIx AI generator. That is why we can say this without blushing: if none of them shows your KPI the way you need, you can generate your own in minutes.
Describe the card in plain words (for example, "OEE tile with the percentage in big digits, availability, performance and quality underneath, green above 85 %, amber above 65 % and red below, and a click event") and the generator walks you through it step by step: the design, the properties, events and methods you will use in WinCC, a simulation to try values and the final Custom Web Control package for WinCC Unified and WinCC V8. The same tool also builds dynamic SVGs when a lightweight drawing is all you need.
- Remix any control on this list: on its product page, the "Edit in AI Generator" button opens it straight in the generator, ready for you to ask for changes such as "make the LED red when inactive", "add a target to the card" or "show eight machines instead of nine". The "Edit it with AI" links in this article do the same.
- Free to try: you can start without an account, with a small daily allowance of credits, and the Community plan is free.
- The result is yours to use: download the package and add it to your TIA Portal project like any other control on this page.
How to use a KPI card Custom Web Control in WinCC Unified (and WinCC V8)
The short version, for when you have already picked your card. Our Custom Web Control guide covers every step with diagrams and screenshots.
Download the ZIP
Open the product page, sign in with your free account and download the control. The downloaded ZIP contains the documentation and, inside it, the control package named
{GUID}.zip: that inner file is the one you need.Copy it into your TIA Portal project
Copy the
{GUID}.zipfile, still compressed, into your project folder underUserFiles\CustomControls(create both folders if they do not exist). Do not extract it.Refresh My controls and drag it in
In TIA Portal, open the Tools task card, expand My controls and click Update. The control appears in the list: drag it onto your screen and size it.
Bind and test the properties
Select the control and open Inspector window → Properties → Properties → Interface. Bind the main value (
rejectCount,isActive,status…) to an internal tag first, add an I/O field that writes the same tag and start Runtime: change the value and watch the card, colours and limits react. Untick Read only on tags the control writes back, such as a reset. Once it behaves, switch to your real PLC tags.On WinCC V8
Every top pick in this article is tagged as compatible with WinCC V8 on its product page. The package is the same; follow the WinCC V8 documentation for importing and configuring Custom Web Controls in that environment.
Pro tip: decide the meaning of each colour once and use it everywhere. If green means running on the Machine Status Grid, it should mean running on the Status LED and the Status Lights too, and an amber tile should always mean warning. Bind the colour properties (accentColor, trendColor…) to the same state logic across the screen, and keep vivid colours for what needs attention, as ISA-101 recommends.
Frequently asked questions
Are these KPI card and status indicator Custom Web Controls really free?
Yes. Every control in this article is published as a free product on HMIx. You only need a free account to download them.
Why use a Custom Web Control for a KPI card in WinCC Unified?
You can build a KPI card from basic objects, I/O fields and dynamisation, but a KPI card Custom Web Control packs the value, unit, trend arrow, limits and status colours into one object with named properties and events. You bind a few tags instead of animating a dozen shapes, and every card on the screen looks and behaves the same.
What is the difference between a KPI card and a status indicator?
A KPI card shows a value, such as pressure, rejects, cycle time or runtime hours, usually with a unit, a trend or limits. A status indicator shows a state, such as running, warning, stopped or alarm, with a colour or a lamp. This article includes both, plus combinations such as the Process Status Indicator, which shows a value with its setpoint and alarm limits.
How do I show the state of several machines on one screen?
Use an overview control such as the Machine Status Grid for a red-yellow-green picture of the whole line, the Status Bar to see how long a machine spent in each state, or several Status LEDs or Status Lights placed on a plant mimic. Check in each control's documentation how states are fed, because some use one property per state and others an array or methods.
Do they work on WinCC Unified Comfort Panels and on WinCC V8?
Their product pages list compatibility with WinCC Unified, including Unified Comfort Panels, and with WinCC V8. As with any AI-generated control, test the behaviour in your own project and on your target device before going into production.
Can I modify one of these cards?
Of course. You can edit the HTML, CSS and JavaScript of the control yourself, or press "Edit in AI Generator" on the product page and ask for the changes in plain language. The second option is usually faster, because the generator takes care of the interface and the packaging.
Our verdict
If you only download one, make it the KPI Indicator: a big value, a unit and a trend arrow in a tile you will have bound in minutes. For a full KPI dashboard, the Crane Logistics KPI; for a measurement with setpoint and limits, the Process Status Indicator; for scrap, the Rejected Parts Counter; for maintenance, the Machine Hour Counter Card; for the whole plant at a glance, the Machine Status Grid; for availability over time, the Status Bar; for a stack light, the Status Lights; for a minimal tile, the Square Info Card; and for a simple on/off signal, the Status LED.
And if your KPI needs a card none of these draws (it always does), remember that the generator that built them is just one click away.