Blog · Custom Web Controls
The 9 best pie chart, Sankey and heatmap Custom Web Controls for WinCC Unified and WinCC V8 (free)
WinCC Unified ships with trend and bar objects, but when you want a pie chart, a Sankey diagram or a heatmap, a Custom Web Control is the shortcut. So in November 2026 we opened every pie, donut, radar, Sankey, heatmap, funnel, scatter and bubble chart Custom Web Control in the HMIx catalogue, seventeen candidates, looked at each preview up close, read every product sheet and kept the nine we would happily drop into a WinCC Unified or WinCC V8 screen. All free, all packaged as a CWC ZIP, and all with their data properties named on the product page or in its TIA Portal screenshots.
- Custom Web Control
- CWC
- WinCC Unified
- WinCC V8
- TIA Portal
- Pie chart
- Sankey diagram
- Heatmap
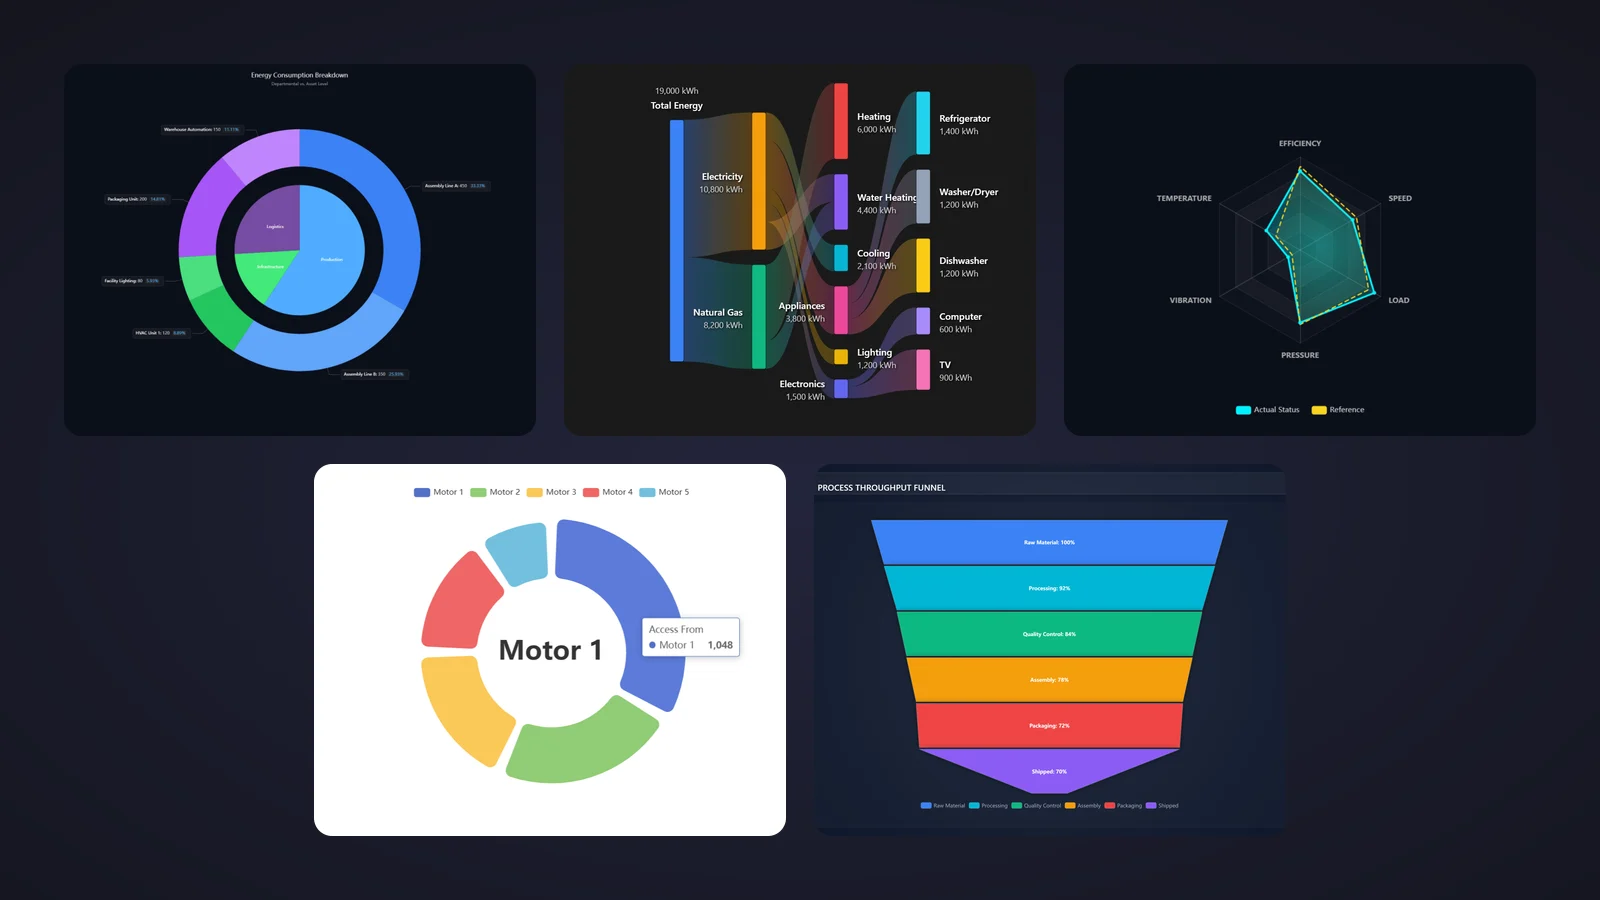
Quick picks
Short on time? Jump straight to the chart you need.
- 01Best overall (pie or donut)Pie Chart
- 02Best for two-level breakdowns (two rings)Nested Pie Chart
- 03Best for actual-versus-reference comparisonsRadar Chart
- 04Crowd favourite: the most downloaded Sankey diagramSankey Diagram
- 05Best for energy breakdowns with values on every nodeHousehold Energy Sankey Diagram
- 06Best for shift and production load mapsHeatmap
- 07Best for 24 × 7 weekly patternsHeatmap Grid
- 08Best for stage-by-stage yield and losses (funnel)Funnel
- 09Best for correlations between two variablesScatter Chart
Why a pie chart, Sankey or heatmap Custom Web Control fills a real gap
Every plant has questions that a trend line answers badly. Where did the shift go: production, setup, idle or faults? Which line eats most of the energy? Which hour of the week always runs hot? A pie chart answers the first, a Sankey diagram the second and a heatmap the third, and none of them is what the standard WinCC objects are built for.
That is where a chart Custom Web Control (CWC) comes in. A CWC is a small web application, HTML, CSS and JavaScript packaged as a ZIP, that WinCC Unified (TIA Portal) and WinCC V8 run inside the screen. Most chart CWCs take their data as an array or a JSON string in a property such as slices, nodes or heatmapData, so your HMI tags and scripts feed the numbers and the control draws them. Many fire events too, such as SliceClicked or CellClicked, so a click on a slice or a cell can open the detail screen.
What makes a chart Custom Web Control worth downloading
Before the list, the yardstick. This is what we looked for, roughly in order of how much it annoys us when it is missing:
- The right chart for the question. Shares of a whole go in a pie, flows in a Sankey, patterns over time in a heatmap, several variables against a reference in a radar. A good-looking chart that answers the wrong question is clutter.
- Readable on a panel. Labels that are not cut, values or percentages you can actually read and a colour scale that explains itself. Fancy gradients are no substitute for a legible number.
- A clean data contract. The data in one documented property (
slices,links,heatmapData,points), so you know exactly what your tags or scripts have to write. - Interaction that goes somewhere. A click event on a slice, node or cell turns a picture into navigation. Sheets that only count their properties went to the honourable mentions.
- One champion per job. A pie or donut, a two-ring pie, a radar, two Sankey diagrams, two heatmaps, a funnel and a scatter chart: different questions, different tools.
How we picked them (and what we did not do)
We searched the HMIx catalogue in November 2026 for every free Custom Web Control that draws pie, donut, radar, Sankey, heatmap, funnel, scatter or bubble charts. Bar and trend charts already have their own articles, so they stayed out. For each candidate we looked at its real preview (not the catalogue cover with the big title on top), read its product sheet and, where the creator published them, the TIA Portal screenshots in its gallery, to see which properties, events and methods it documents. Downloads only worked as tie-breakers.
Controls whose pages do not name their properties went to the honourable mentions. We discarded one bubble chart whose axis reads "Efficiency (%)" up to 70,000, and one chart we already picked in our bar chart article. And a fair warning: we judged previews and documentation; we did not run these controls in a live Runtime. They were generated with AI and every product page reminds you to test them in your own TIA Portal project before production.
The 9 best pie, Sankey, heatmap and other chart Custom Web Controls, one by one
Each entry shows the real preview, what we liked, what to keep in mind and the properties named on its product page, followed by the catalogue thumbnail: click it to open the product page and download the chart for free.
01Best overall (pie or donut)
Pie Chart
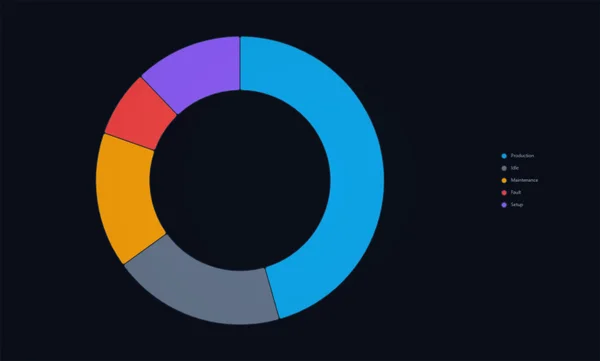
If we could only keep one, it would be this one, because it answers the question you will be asked most: where did the time go? The preview shows a clean dark donut split into Production, Idle, Maintenance, Fault and Setup, in blue, grey, orange, red and purple, with a discreet legend on the right. It is exactly the equipment state breakdown that an OEE screen needs, and it does not shout.
Pie or donut is your call: innerRadius and outerRadius are percentages, so an inner radius of zero gives you a classic pie. The data goes into the slices array, title adds a heading, showLegend and legendPosition (top, bottom, left or right) place the legend, and backgroundColor matches your theme. According to its sheet, the tooltips show each value with its unit, SliceClicked lets a click open the detail of a state, and the refresh and resetValues methods clear the chart at a batch change.
What we like
- Pie or donut with two percentage properties
- Calm, readable look on dark screens
- Click event per slice for drill-down
Keep in mind
- No values or percentages on the slices in the preview: the operator has to hover or read the legend
- The sheet counts eight properties but names seven: check the unit property in TIA Portal
Bindable properties
- title
- slices
- innerRadius
- outerRadius
- showLegend
- legendPosition
- backgroundColor
02Best for two-level breakdowns (two rings)
Nested Pie Chart
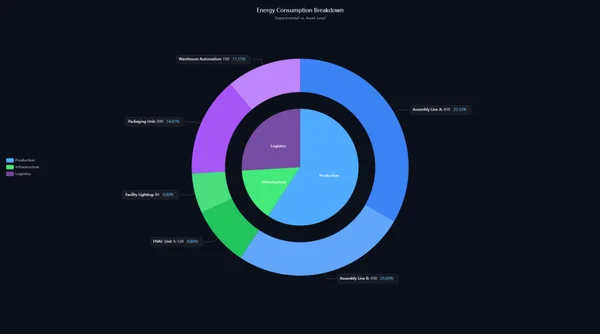
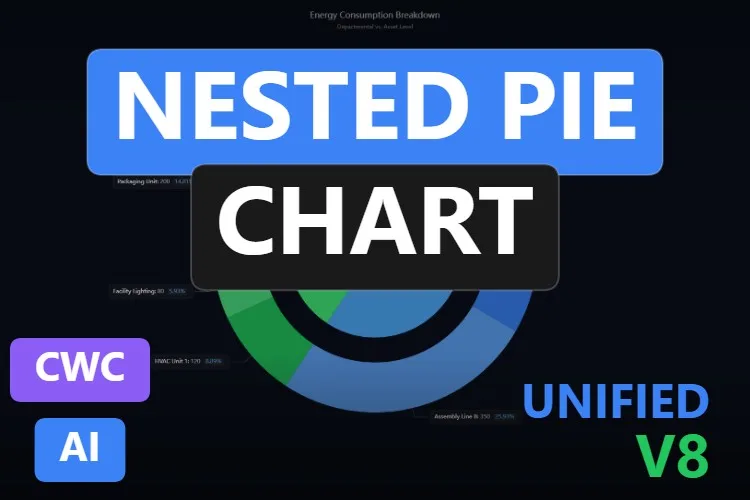
One pie tells you that production uses most of the energy; this one also tells you which line. The preview, "Energy Consumption Breakdown", has an inner pie with three departments (Production, Infrastructure and Logistics) and an outer ring with their assets, each with a label box showing the value and the percentage: "Assembly Line A: 450, 33.33%", "HVAC Unit 1: 120, 8.89%" and so on.
Its sheet announces 17 properties and names twelve of them. The data goes into innerSectors and outerSectors; the geometry into innerRadius, outerRadiusStart and outerRadiusEnd; the texts into titleText, subtitleText and unitLabel; and the labels into labelRichBackgroundColor and labelLineLength. theme switches between light and dark, animationDuration softens updates, SectorClicked reports clicks and resetSelection clears them.
What we like
- Two levels of detail in a single chart
- Value and percentage on every outer sector
- Light and dark themes built in
Keep in mind
- The labels are small in the preview: give it a big tile or fewer sectors
- Five of its 17 properties are not named on the page
Bindable properties
- innerSectors
- outerSectors
- titleText
- subtitleText
- unitLabel
- theme
- innerRadius
- outerRadiusStart
- outerRadiusEnd
- labelRichBackgroundColor
- labelLineLength
- animationDuration
03Best for actual-versus-reference comparisons
Radar Chart
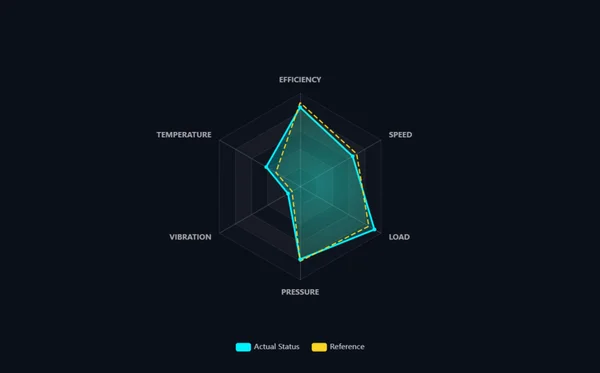
A radar chart is the quickest way to see whether a machine is behaving like its reference. This one draws six axes (efficiency, speed, load, pressure, vibration and temperature) on a dark hexagonal grid, with a filled cyan polygon for "Actual Status" and a dashed yellow one for "Reference". Where the two shapes separate, there is something to look at.
Its seven properties are all named on the sheet. indicators defines the axes and their maximum, series carries the data, chartTitle and showLegend add context, labelColor and backgroundColor style it and animationDuration softens the transitions. PointClicked reports which point was clicked, useful to open the trend of that variable.
What we like
- Actual and reference in one glance
- Short, fully documented interface
- Calm colours and readable axis names
Keep in mind
- Each axis has its own maximum: scale your values sensibly or the shape will mislead
- No title in the preview: set
chartTitleso the operator knows which machine it is
Bindable properties
- indicators
- series
- chartTitle
- showLegend
- labelColor
- backgroundColor
- animationDuration
04Crowd favourite: the most downloaded Sankey diagram
Sankey Diagram
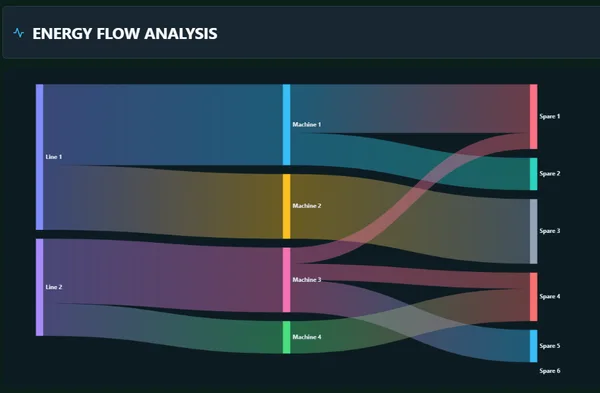
Of the Sankey diagrams in our search, this is the one people download most (16 downloads and two five-star reviews in November 2026). The preview we show is a dark "ENERGY FLOW ANALYSIS" panel: two lines feed four machines, which split into six outputs, with wide translucent ribbons whose thickness follows the value. Another gallery image shows a hover that dims everything except one link and labels it "Machine 3 -- Spare 1 10".
Its sheet only says it has nine properties and two events, but the gallery includes two TIA Portal screenshots of the Inspector window that settle the question. The structure lives in two arrays: nodes (each element has a name) and links (each with source, target and value). Around them, title and showTitle for the header, nodeWidth and nodeGap for the columns, and curveness and linkOpacity for the ribbons. Seeing the arrays edited in TIA Portal is exactly the reassurance you want before binding.
What we like
- Data structure shown in real TIA Portal screenshots
- Simple model: a list of names and a list of source-target-value links
- Hover highlighting makes a busy diagram readable
Keep in mind
- The first gallery image cuts the labels on the right ("Production I", "HVAC Syste"): leave room for them
- The two events are not named on the page: check them in the included documentation
Bindable properties
- nodes
- links
- title
- showTitle
- nodeWidth
- nodeGap
- curveness
- linkOpacity
05Best for energy breakdowns with values on every node
Household Energy Sankey Diagram
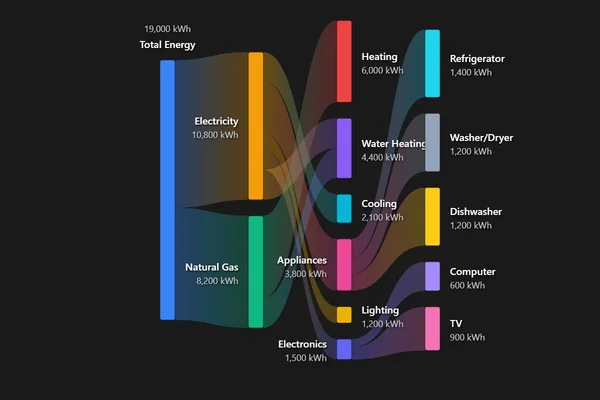
The most informative Sankey diagram in the catalogue, and the only one that writes the value on every node. Total Energy (19,000 kWh) splits into Electricity (10,800) and Natural Gas (8,200), then into heating, water heating, cooling, appliances, lighting and electronics, and finally into refrigerator, washer and dryer, dishwasher, computer and TV. We added it up: every level of the demo sums correctly, which is more than many energy reports manage.
With 28 properties it is also the most configurable. The sheet names ShowLabels and ShowValues for the text, FlowOpacity for the ribbons, AnimationEnabled for the transitions, nodeWidth and nodePadding for the layout and margin properties such as marginTop and marginRight to stop labels being clipped. It fires NodeClicked and FlowSelected, and the updateFlowValue, UpdateData and SetAnimationSpeed methods refresh it from your scripts.
What we like
- Values in kWh on every node, readable without hovering
- Three levels of breakdown that add up
- Very configurable, with events on nodes and flows
Keep in mind
- It is designed for a household, and its sheet names sources and uses such as
TotalElectricity,GasHeatingandRefrigerator: check in the documentation how far you can rename them for a plant - Some labels ("Water Heating", "Appliances") sit on top of the ribbons
Bindable properties
- ShowLabels
- ShowValues
- FlowOpacity
- AnimationEnabled
- nodeWidth
- nodePadding
- marginTop
- marginRight
Household Energy Sankey Diagram
Free · WinCC Unified & V8 · CWC (.zip)
06Best for shift and production load maps
Heatmap
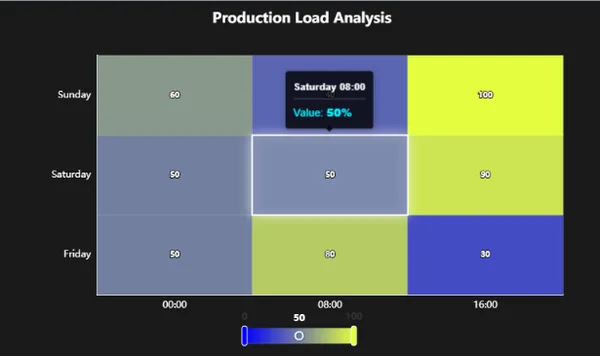
Where the Heatmap Grid shows a whole week hour by hour, this one is happy to be small and precise. The preview we show is a "Production Load Analysis" grid of three days by three shifts (00:00, 08:00 and 16:00) with the value printed in every cell, a white outline around the selected cell, a tooltip with "Value: 50%" and a colour scale with handles underneath. Its first gallery image is the full-size version: seven days by 24 hours, from cool blues at night to orange at midday.
It is the best documented heatmap of the two. The sheet names startColor and endColor for the gradient, minValue and maxValue for its range, showValueLabels for the numbers in the cells, unitLabel for the tooltips, backgroundColor, and xAxisLabels and yAxisLabels, which accept a JSON array or a comma-separated string. A TIA Portal screenshot in the gallery adds chartTitle and the heatmapData array, whose elements carry value, x and y. CellClicked, refreshChart and clearData complete the set.
What we like
- Values in the cells with
showValueLabels: readable without hovering - Two-colour gradient that you can tone down to your palette
- Data structure visible in a TIA Portal screenshot
Keep in mind
- The default blue to yellow-green gradient is loud: pick calmer
startColorandendColorvalues - In the preview, the tooltip covers the value of the cell above it
Bindable properties
- heatmapData
- chartTitle
- xAxisLabels
- yAxisLabels
- minValue
- maxValue
- startColor
- endColor
- showValueLabels
- unitLabel
- backgroundColor
07Best for 24 × 7 weekly patterns
Heatmap Grid
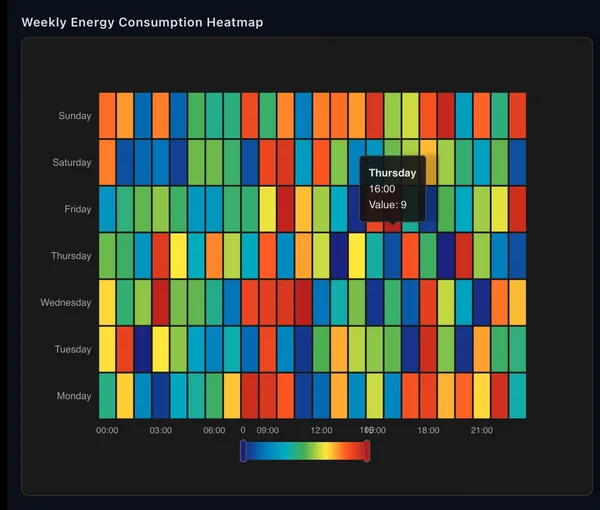
The classic question for an energy manager: on which day and at which hour do we consume most? This grid lays out seven days by 24 hours in a "Weekly Energy Consumption Heatmap" panel, colours each cell on a scale from dark blue to red and shows a tooltip such as "Thursday 16:00, Value: 9" when you hover. Shift patterns, cleaning cycles and weekend base load jump out of a picture like this.
Its nine properties are all named on the sheet: heatmapData for the values, xAxisLabels and yAxisLabels for the axes, minValue and maxValue for the colour range, showVisualMap to show or hide the scale, valuePrefix for the tooltip, plus titleText and backgroundColor. CellClicked reports the cell, and refreshData and clearSelection give your scripts control.
What we like
- The natural layout for weekly patterns
- Fully documented, short interface
- Colour scale that can be hidden with
showVisualMap
Keep in mind
- In the preview, the scale labels (0 and 10) overlap the hour labels
- A rainbow scale with random demo data looks busy, and the sheet names no colour property: remix it for a calmer palette
Bindable properties
- heatmapData
- titleText
- xAxisLabels
- yAxisLabels
- minValue
- maxValue
- showVisualMap
- valuePrefix
- backgroundColor
08Best for stage-by-stage yield and losses (funnel)
Funnel
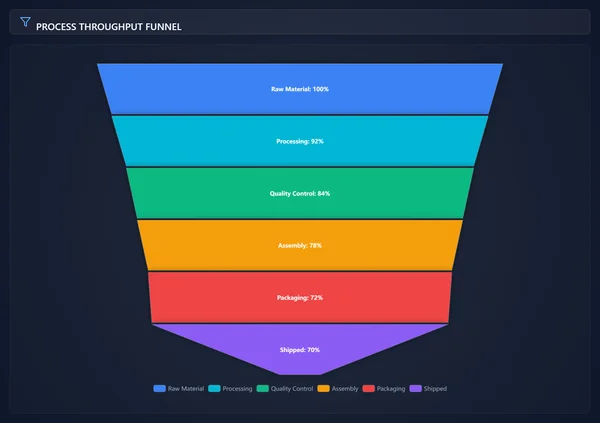
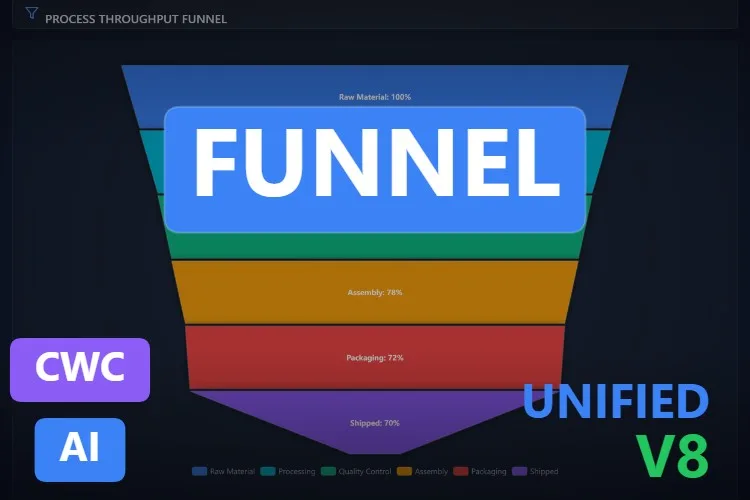
Out of every hundred parts that start the line, how many reach the truck, and where do the others fall out? A funnel answers that in one picture. The preview is a dark "PROCESS THROUGHPUT FUNNEL" panel with six stacked stages that narrow from top to bottom: Raw Material 100%, Processing 92%, Quality Control 84%, Assembly 78%, Packaging 72% and Shipped 70%, each in its own colour and with a legend at the bottom. The biggest step is where you go looking first.
Its sheet names all seven properties. The data lives in the stages array, title sets the header, showLegend and showLabels toggle the legend and the text in each stage, gap spaces the segments, minSize keeps a tiny last stage visible and backgroundColor matches your theme. OnStageSelected fires when the operator clicks a stage, updateValueByName changes one stage without resending the whole list and refreshChart redraws it after a resize.
What we like
- Losses per stage visible at a glance
- Short interface, all seven properties named
- Update a single stage by name from a script
Keep in mind
- The labels inside the stages are small in the preview: give it height
- The sheet does not describe the fields of each
stageselement: check the included documentation before writing your script
Bindable properties
- stages
- title
- showLegend
- showLabels
- gap
- minSize
- backgroundColor
09Best for correlations between two variables
Scatter Chart
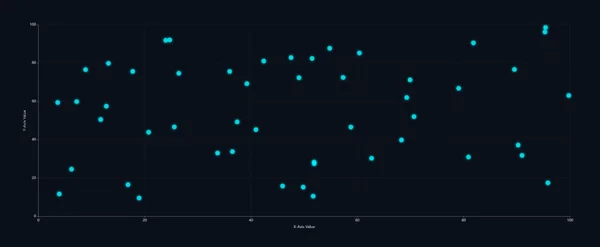
Does the motor current rise with the load? Do rejects pile up at high temperature? Those are scatter chart questions, and this is the only dedicated scatter chart we found, and a clean one. The preview is plain on purpose: around fifty cyan points on a dark background, axes from 0 to 100 and a faint dashed grid.
Eight properties, all named on its sheet: the points array for the data, chartTitle, xAxisLabel and yAxisLabel for context, pointColor and pointSize for the markers, showGrid and backgroundColor. PointClicked lets the operator click a point to open the batch or the moment behind it, and refreshChart redraws it after a resize.
What we like
- Everything named on the sheet, nothing hidden
- Minimal look that suits high-performance HMI screens
- Click event per point for drill-down
Keep in mind
- A single series and colour: to compare two groups, look at the Bubble Chart in the mentions or remix it
- The preview keeps the generic "X-Axis Value" and "Y-Axis Value" labels: set yours
Bindable properties
- points
- chartTitle
- xAxisLabel
- yAxisLabel
- pointColor
- pointSize
- showGrid
- backgroundColor
Honourable mentions: 6 more charts worth a look
They did not make the top nine, mostly because their product pages do not name their properties or because they are very specialised, but each one has a good reason to exist. Click any thumbnail to open its product page.
Pie Chart - Dashboard Widget
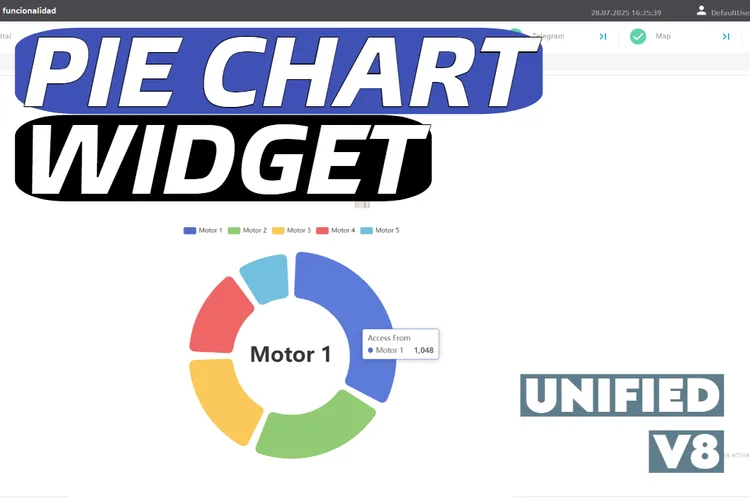
The veteran of the group (July 2025) and, with 68 downloads in November 2026, the most downloaded control of this search. Built on Apache ECharts, with a rounded donut and a big label in the centre; its gallery also shows it on a real WinCC Unified screen. The page does not name its properties, and the tooltip still says "Access From", a leftover from the ECharts demo.
View product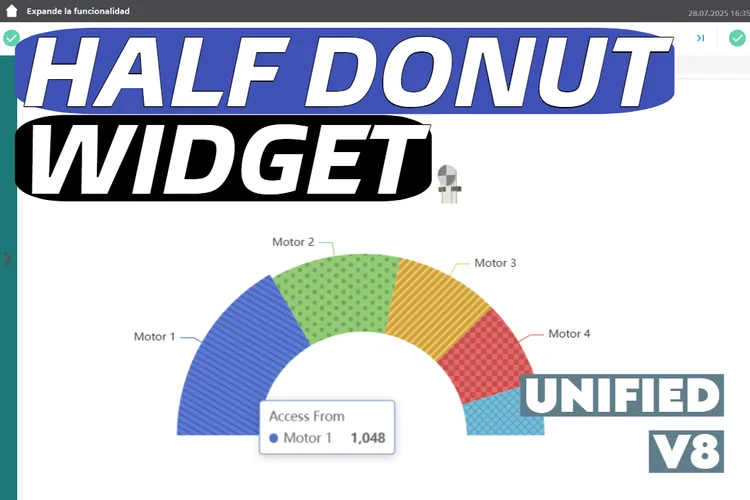
Half Donut Chart - Dashboard Widget
Its sibling: a half donut with patterned slices, also based on Apache ECharts and with the same "Access From" tooltip. A good fit for a compact share-of-load display, but its properties are not named on the page.
View product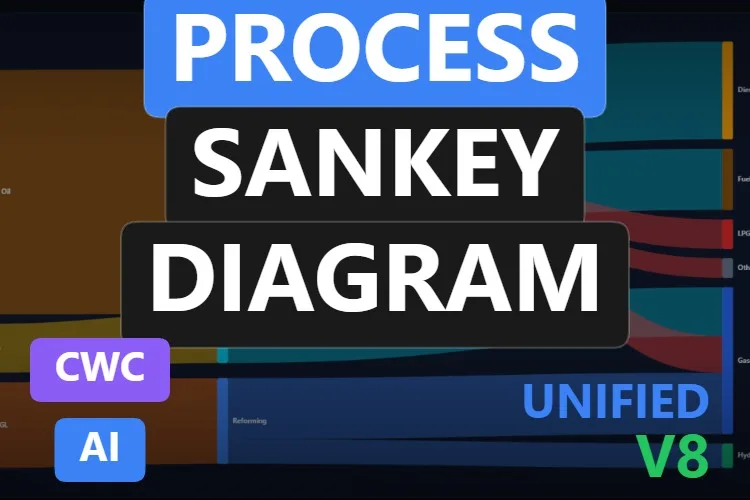
Process Sankey Diagram
A refinery mass balance: crude oil, steam and gas through distillation, reforming and catalytic cracking into diesel, fuel oil, LPG, gasoline and hydrogen. A beautiful preview, but its nine properties, two events and two methods are not named.
View product
Sankey Diagram
Eleven properties, ten of them named on the sheet, such as
View productnodesData,linksDataandenableDragging, plus anexportAsImagemethod. It missed the list because its preview is washed out on a light grey background and its labels are hard to read.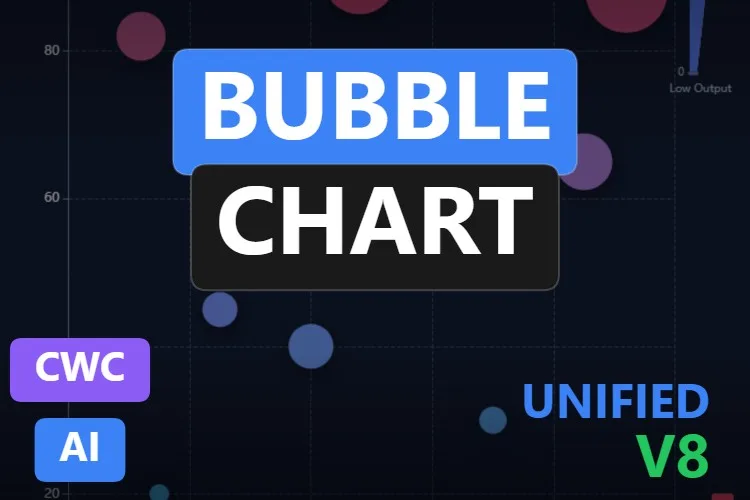
Bubble Chart
A "Process Performance Matrix": pressure on one axis, temperature on the other and bubble size and colour for output. The sheet counts ten properties, one event and two methods without naming them.
View product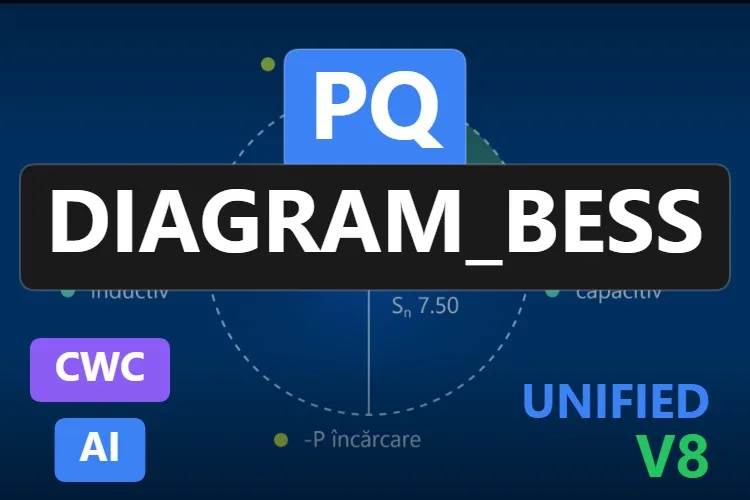
PQ Diagram_BESS
A specialist: it plots the operating point of a battery energy storage system on an active and reactive power (P-Q) diagram, inside a circle set by
View productnominalApparentPower, highlights the active quadrant and firesLimitExceededwhen the rating is exceeded. Brand new in November 2026, and the preview labels are in Romanian ("descărcare", "încărcare"), although its sheet says every legend and axis label can be changed.
Didn't find your chart? Make your own (or remix one) with AI, for free
A confession: all nine charts on our list were created with the HMIx AI generator. That is why we can say this without blushing: if none of them draws your data the way you need, you can generate your own in minutes.
Describe the chart in plain words (for example, "donut chart of the shift time split into running, setup, idle and fault, with the percentage on each slice, the total hours in the centre and a click event per slice") and the generator walks you through it step by step: the design, the properties, events and methods you will use in WinCC, a simulation to try values and the final Custom Web Control package for WinCC Unified and WinCC V8. The same tool also builds dynamic SVGs when a lightweight drawing is all you need.
- Remix any chart on this list: on its product page, the "Edit in AI Generator" button opens it straight in the generator, ready for you to ask for changes such as "show the percentage on each slice", "use a grey to orange scale" or "rename the household nodes to production lines". The "Edit it with AI" links in this article do the same.
- Free to try: you can start without an account, with a small daily allowance of credits, and the Community plan is free.
- The result is yours to use: download the package and add it to your TIA Portal project like any other chart on this page.
How to use a chart Custom Web Control in WinCC Unified (and WinCC V8)
The short version, for when you have already picked your chart. Our Custom Web Control guide covers every step with diagrams and screenshots.
Download the ZIP
Open the product page, sign in with your free account and download the chart. The downloaded ZIP contains the documentation and, inside it, the control package named
{GUID}.zip: that inner file is the one you need.Copy it into your TIA Portal project
Copy the
{GUID}.zipfile, still compressed, into your project folder underUserFiles\CustomControls(create both folders if they do not exist). Do not extract it.Refresh My controls and drag it in
In TIA Portal, open the Tools task card, expand My controls and click Update. The chart appears in the list: drag it onto your screen and give it room for its labels.
Bind and test the properties
Select the control and open Inspector window → Properties → Properties → Interface. Most of these charts take their data as an array or a JSON string (
slices,links,heatmapData,points…): fill it with two or three static elements first, start Runtime and check the drawing. Then bind the values to internal tags and change them with an I/O field. Untick Read only on any property the control has to write back. Once it behaves, switch to your real tags.On WinCC V8
Every top pick in this article is tagged as compatible with WinCC V8 on its product page. The package is the same; follow the WinCC V8 documentation for importing and configuring Custom Web Controls in that environment.
Pro tip: a pie chart only works with a handful of slices that add up to a meaningful whole, such as the hours of a shift or the energy of a meter. Past six or seven slices, group the small ones into "Other" or switch to a bar chart. And in a Sankey diagram, check that what enters each node equals what leaves it: the eye notices a ribbon that appears out of nowhere.
Read the complete Custom Web Control guideFrequently asked questions
Why use a Custom Web Control for a pie chart in WinCC Unified?
The standard WinCC objects are built around trends, bars and process values. When you want a pie or donut chart, a Sankey diagram or a heatmap with your own data and a click event, a chart Custom Web Control gives you that chart ready to import into TIA Portal and bind.
Are these chart Custom Web Controls really free?
Yes. Every chart in this article is published as a free product on HMIx. You only need a free account to download them.
How do I send my tag values to a pie chart or a Sankey diagram?
These charts take their data in a property such as slices, innerSectors, nodes and links or heatmapData, usually an array or a JSON string. In TIA Portal you can fill the array elements in the Inspector window and bind each value to a tag, or build the string in a WinCC script. Check the exact format in the documentation included in the download.
When should I use a Sankey diagram instead of a pie chart?
Use a pie chart for the shares of a single whole, such as the states of a machine during a shift. Use a Sankey diagram when the quantity flows through stages, such as energy from the grid and the gas meter to departments and machines, or material through a process. A heatmap is the right choice when the question is when: by hour, day or shift.
Do they work on WinCC Unified Comfort Panels and on WinCC V8?
Their product pages list compatibility with WinCC Unified, including Unified Comfort Panels, and with WinCC V8. As with any AI-generated control, test the behaviour in your own project and on your target device before going into production, especially label legibility on small screens.
Can I modify one of these charts?
Of course. You can edit the HTML, CSS and JavaScript of the control yourself, or press "Edit in AI Generator" on the product page and ask for the changes in plain language. The second option is usually faster, because the generator takes care of the interface and the packaging.
Our verdict
If you only download one, make it the Pie Chart: a calm donut for machine states that you will have bound in minutes. For a two-level breakdown, the Nested Pie Chart; for actual against reference, the Radar Chart; for energy or material flows, the Sankey Diagram, or the Household Energy Sankey Diagram when you want the values on every node; for shift loads, the Heatmap; for a whole week hour by hour, the Heatmap Grid; for losses stage by stage, the Funnel; and for "does A depend on B?", the Scatter Chart.
And if your data needs a chart none of these draws (it always does), remember that the generator that built them is just one click away.